Categories
- All Categories
- Oracle Analytics and AI Learning Hub
- 54 Oracle Analytics and AI Sharing Center
- 26 Oracle Analytics and AI Lounge
- 312 Oracle Analytics and AI News
- 57 Oracle Analytics and AI Videos
- 16.4K Oracle Analytics and AI Forums
- 6.7K Oracle Analytics and AI Labs
- Oracle Analytics and AI User Groups
- 117 Oracle Analytics and AI Trainings
- 24 Oracle Analytics and AI Challenge
- Find Partners
- For Partners
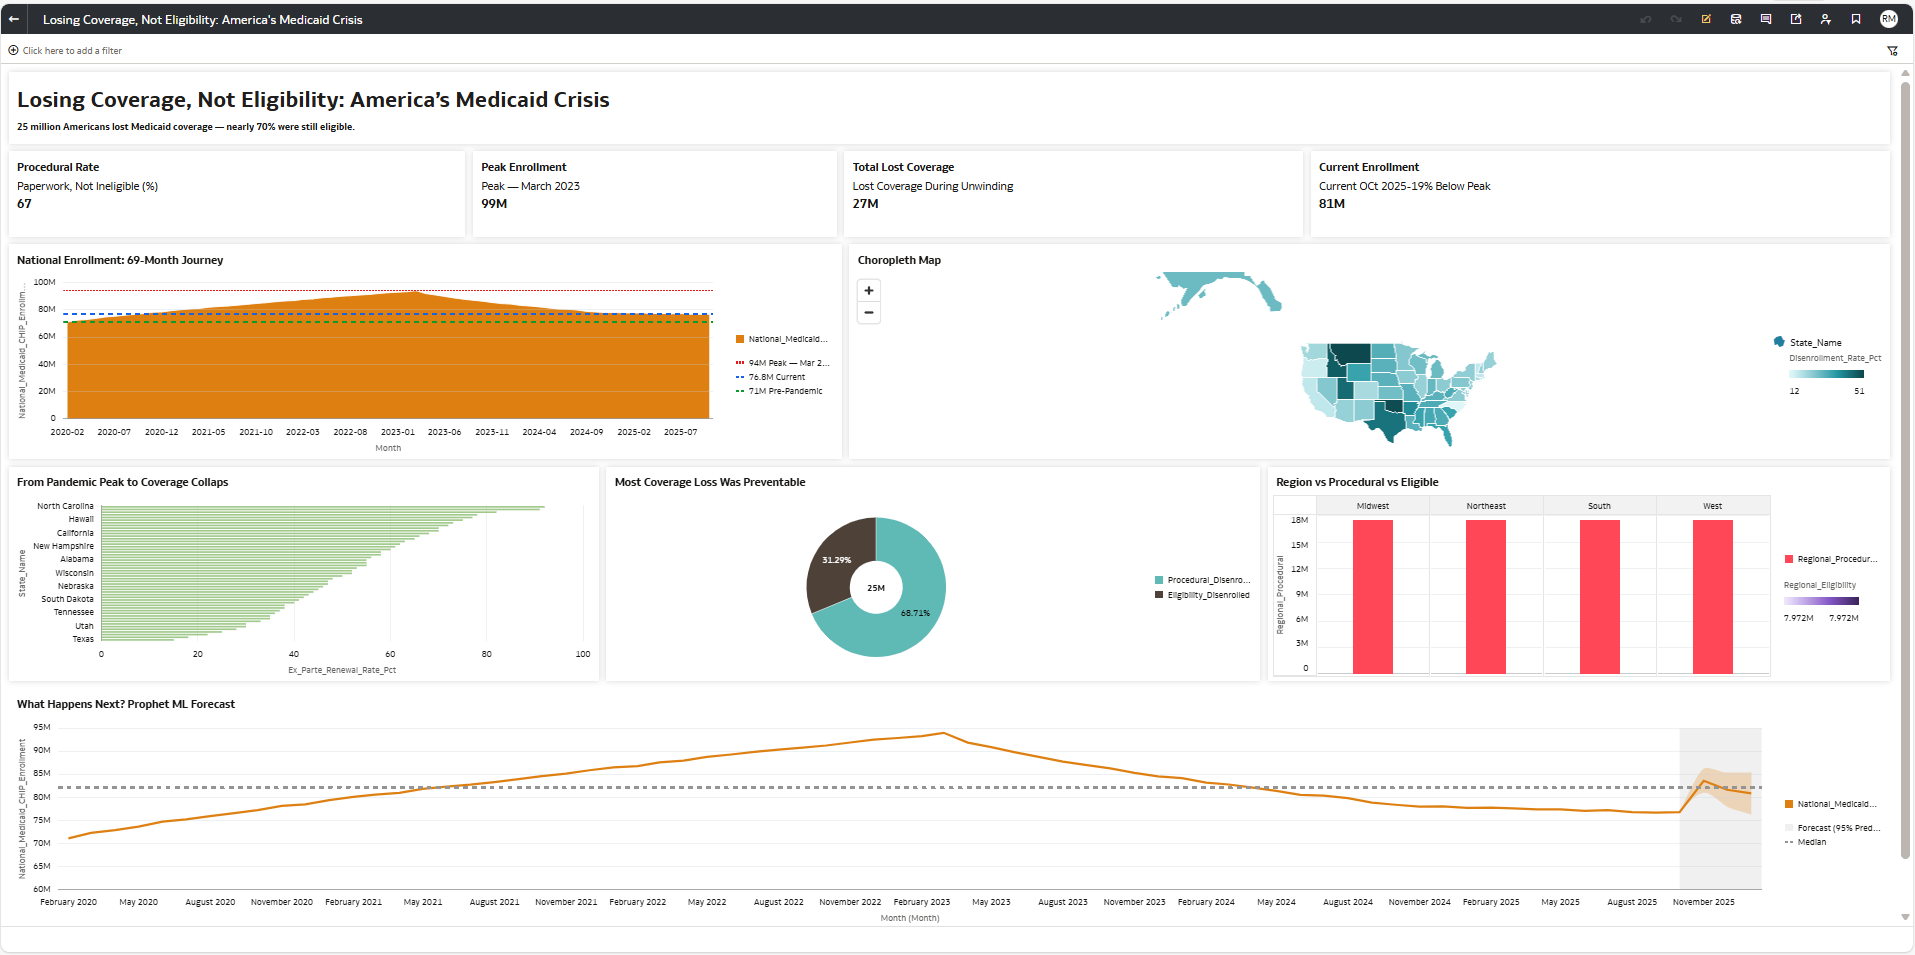
Losing Coverage, Not Eligibility: America's Medicaid Crisis

1. Which dataset did you use?
Public Medicaid enrollment data from Kaiser Family Foundation (KFF), Centers for Medicare & Medicaid Services (CMS), and MACPAC. Covers all 50 states + DC, 69 months of national enrollment trends, and 18 months of renewal outcomes during the Medicaid unwinding (2023-2024).
2. How did you analyze or prepare the data?
Joined three CSVs in OAC, created custom calculations for disenrollment rates, procedural percentages, and regional aggregations. Converted Month to Date type for Prophet ML forecasting. Added reference lines for peak and current enrollment thresholds.
3. Who is the intended audience for your visualization?
Healthcare policy leaders and state Medicaid directors responsible for enrollment strategy and renewal process improvement.
4. What is your visualization about, and what question or problem does it address?
Over 25 million Americans lost Medicaid coverage during the 2023-2024 unwinding — 69% due to paperwork, not ineligibility. This visualization explores where the crisis hit hardest, why automation gaps drove disparate outcomes, and what Prophet ML forecasting predicts for future enrollment.
5. Did you use any Oracle Analytics AI features?
Yes, Prophet ML Forecasting to project enrollment trends with 95% confidence intervals, Geographic Conversion for the choropleth map, and Custom Calculations for derived metrics.
6. Did you upload your visualization image and DVA file?
Yes, I have uploaded both the visualization image and the DVA file.