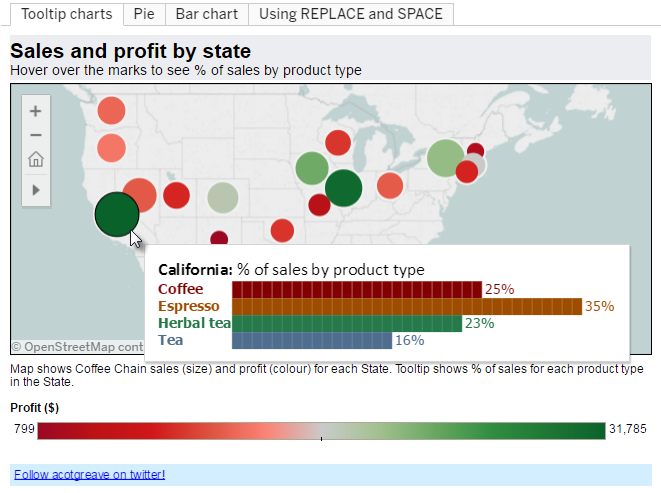
Ability to insert visualizations inside the data tooltip
There should be option to insert visualization inside the data tooltip like Map and Bar chart in tooltip.
Original Idea Number: aed775c63e
Do you envision just a sparkline or a larger chart in a tooltip ? If so, what are the minimum dimensions you would expect ?
Any thoughts how you would like that to work/render on mobile ?
J
This would be great. I know other BI tools allow this type of functionality. It would allow for conservation of space as well on the canvases by allowing more visuals available to users without actually having them displayed fulltime.
PFA the image, I am expecting this kind of functionality which is available in other BI tools.
Not thought about it on Mobile yet.
This is indeed a great addition to improve the flexibility in designing content.
Yes, like Power BI has.
Any Update from Oracle if we can incorporate this functionality.
We want to increase the rest api limit for this payload to incease from current 25 limit to 100. we are calling this api through RF Smart and due to limitation for paging size, the packing units more than 25 does not show up. Can you please increase the limit atleast to 100.…
We have observed a potential issue with dataset refresh schedules when changing the Data Access mode. When a dataset is configured with Automatic Caching, a reload schedule can be defined to refresh the data at specified intervals. However, if the Data Access setting is subsequently changed from Automatic Caching to Live,…
Would like for the old classic BIP bursting feature to be fully Agent aware so that end users no longer need to be concerned with scheduling via the classic console or building out as many BIP reports just to support this one thing.
We have various data sources in Microsoft Fabric and need the ability to build reports in Oracle Analytics Cloud that connect to data sources in Microsoft Fabric. This is an unavoidable reality in today's complex data ecosystems. Microsoft Fabric requires authentication via Microsoft Entra. We opened an SR and Oracle told…
With the OAC Visualization AI Skill, users can potentially extend existing custom visualizations and address limitations encountered in real-world use cases. As an example, we used the AI Skill to enhance the OracleVectorMapsH3 visualization from approximately 10,000 data points to a version supporting up to 50,000 data…