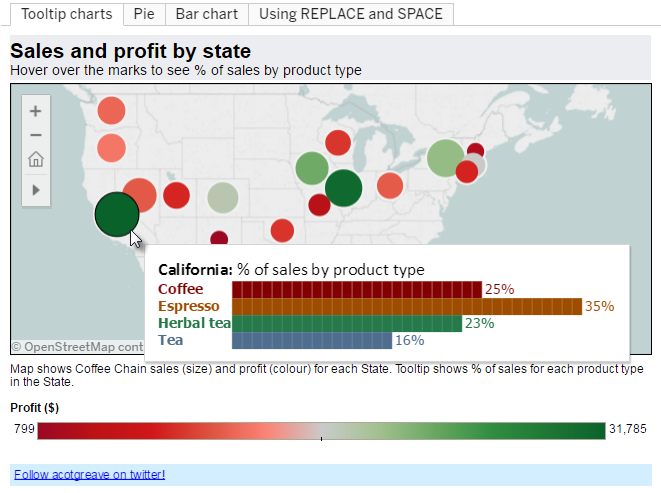
Ability to insert visualizations inside the data tooltip
There should be option to insert visualization inside the data tooltip like Map and Bar chart in tooltip.
Original Idea Number: aed775c63e
Do you envision just a sparkline or a larger chart in a tooltip ? If so, what are the minimum dimensions you would expect ?
Any thoughts how you would like that to work/render on mobile ?
J
This would be great. I know other BI tools allow this type of functionality. It would allow for conservation of space as well on the canvases by allowing more visuals available to users without actually having them displayed fulltime.
PFA the image, I am expecting this kind of functionality which is available in other BI tools.
Not thought about it on Mobile yet.
This is indeed a great addition to improve the flexibility in designing content.
Yes, like Power BI has.
Any Update from Oracle if we can incorporate this functionality.
How to schedule 'Generate Audit Report' monthly 2nd day , so that it generates output for the last month We have tried creating new custom job similar to Generate Audit Report and enabled Date Argument Numbers (1,2) which is the date parameters , but it was not returning the data as expected. Its taking the number of days…
There are more menu options made readily available by default to non-admin users that we wish to restrict. It seems this functionality, to control menu options in the user button menu on the upper-right-hand-side of OAC (DV), is not currently available. Can we be given the ability to customize this menu? Ideally via…
Right now once you save a workbook, that's it. If you (or someone else with edit access) changes a canvas, deletes a calc or messes up a filter and saves, there's no easy way to get back to how it was. The options are digging out an old .dva export if you happened to take one, or asking an admin about a snapshot, which…
Right now, OAC offers pre-built pages and watchlists related to NSAW. At our University, we do not need these pages, and we want to delete them entirely. We've been told in response to our SR that all we can do is keep "Access" limited to only the default admin and sysAdmin roles. This prevents regular users from seeing…
It would be nice to have a way to right click on an object (subject Area, Column, Calculation, etc.) in the Data Panel and show where that object is referenced in a workbook = canvas, visualization, filter, calculation, data action, etc.) In Workbooks with multiple canvases and multiple subject areas, we are left to hover…