Summary
In OAC charts, I want to dictate colors in visualizations, as per my requirements.
Content
In OAC charts how do I dictate the colors in visualisations?
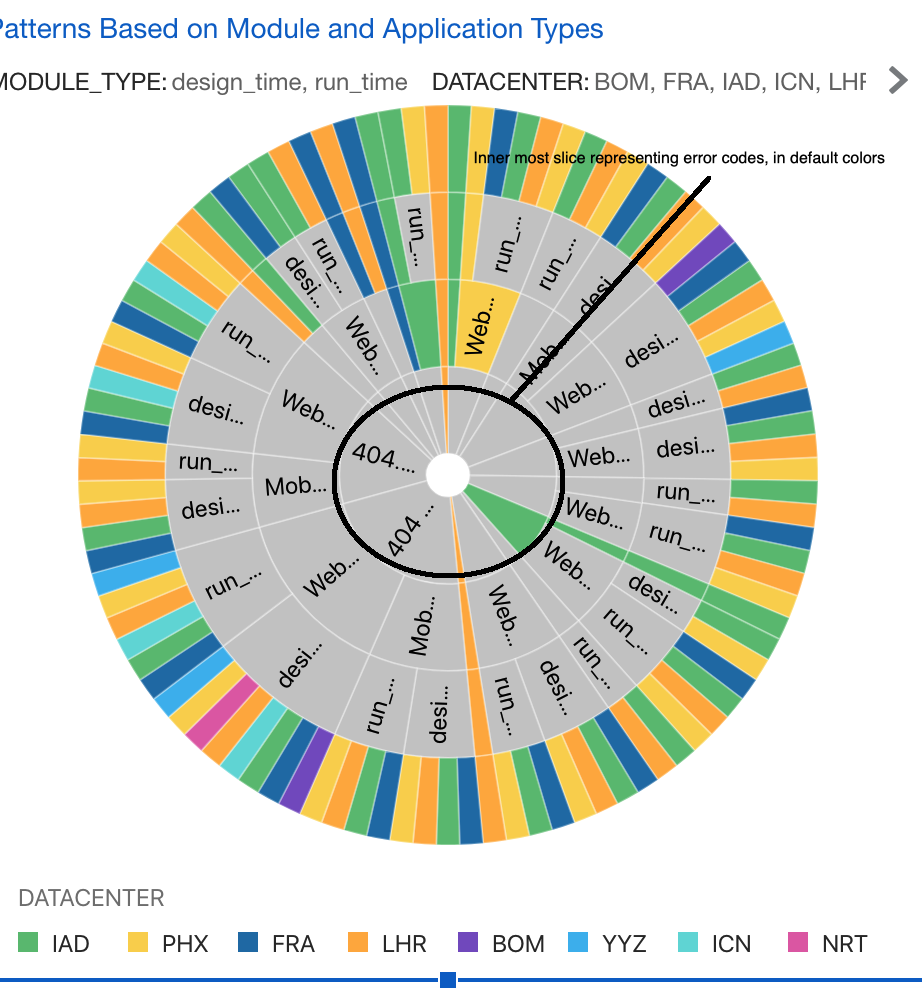
For ex, I am using sunburst chart to represent some hierarchical data. The inner most slice in my sunburst chart represents different error codes. Currently, I have represented “Error code" as the inner most Category (Slice) and it is as shown in the screenshot. Is there a way to show this entire slice in red color? This is because, I want to represent each of the error code with red color.
Thanks in advance,
Chethana