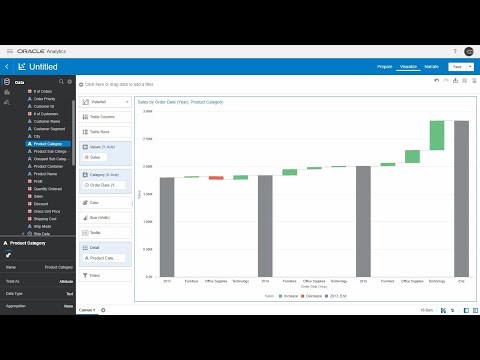
Has anyone else seen weird behavior with simple waterfall chart.
This is what i have in DV. all the values are coming in as decrease when they clearly are a mix
Hello Wayne, happy new year.
In this case, the viz engine in DV performs a slightly different aggregation than the one in Answers. Answers Waterfall takes your input data (your result set) already as the 'variation' data, while DV Waterfall considers your result-set data as a the 'balance' data and computes the variation. The current DV format is actually more flexible than the Answers one : if all you have is transaction data (your example), you simply need to define a rsum() calculation and show it in the Waterfall. It will work. See picture below with two vizs to compare. First Waterfall on the left shows profit (in black in the above table), the waterfall actually computes the difference between each row of the result-set and visualizes it. I have shown a custom calculation (blue font in the table) to mimic what the WF is doing. Second Waterfall on the right shows cumulated profit metric. This is a simple rsum calculation which I also show in green in the above table. In this case it's showing what you need. Hopefully that helps with your question, let me know if not.
FYI Notice that the DV also has an extra computation option when you use a column in the 'detail' grammar, to build a bridge visual, but that's a different topic (see this video if you are interested https://youtu.be/N7yK6AiZ_oI )
Thanks
Philippe
yet in Analysis it same dataset behaves fine
Hello Philippe Lions-Oracle
Thnks a lot for the explanation it was very useful,
I have tried it and I see that it works but I have noticed that if I change the order of emmbers I have in the Y axis the sum will be the same and so the first member wil no longer be good, is there a way to fix that ?