How to Make Group of Rows in Oas DV — Oracle Analytics

Oracle Analytics Cloud and Server

Welcome to the Oracle Analytics Community: Please complete your User Profile and upload your Profile Picture

How to Make Group of Rows in Oas DV

Accepted answer
163
Views
2
Comments

Hi Gurus,

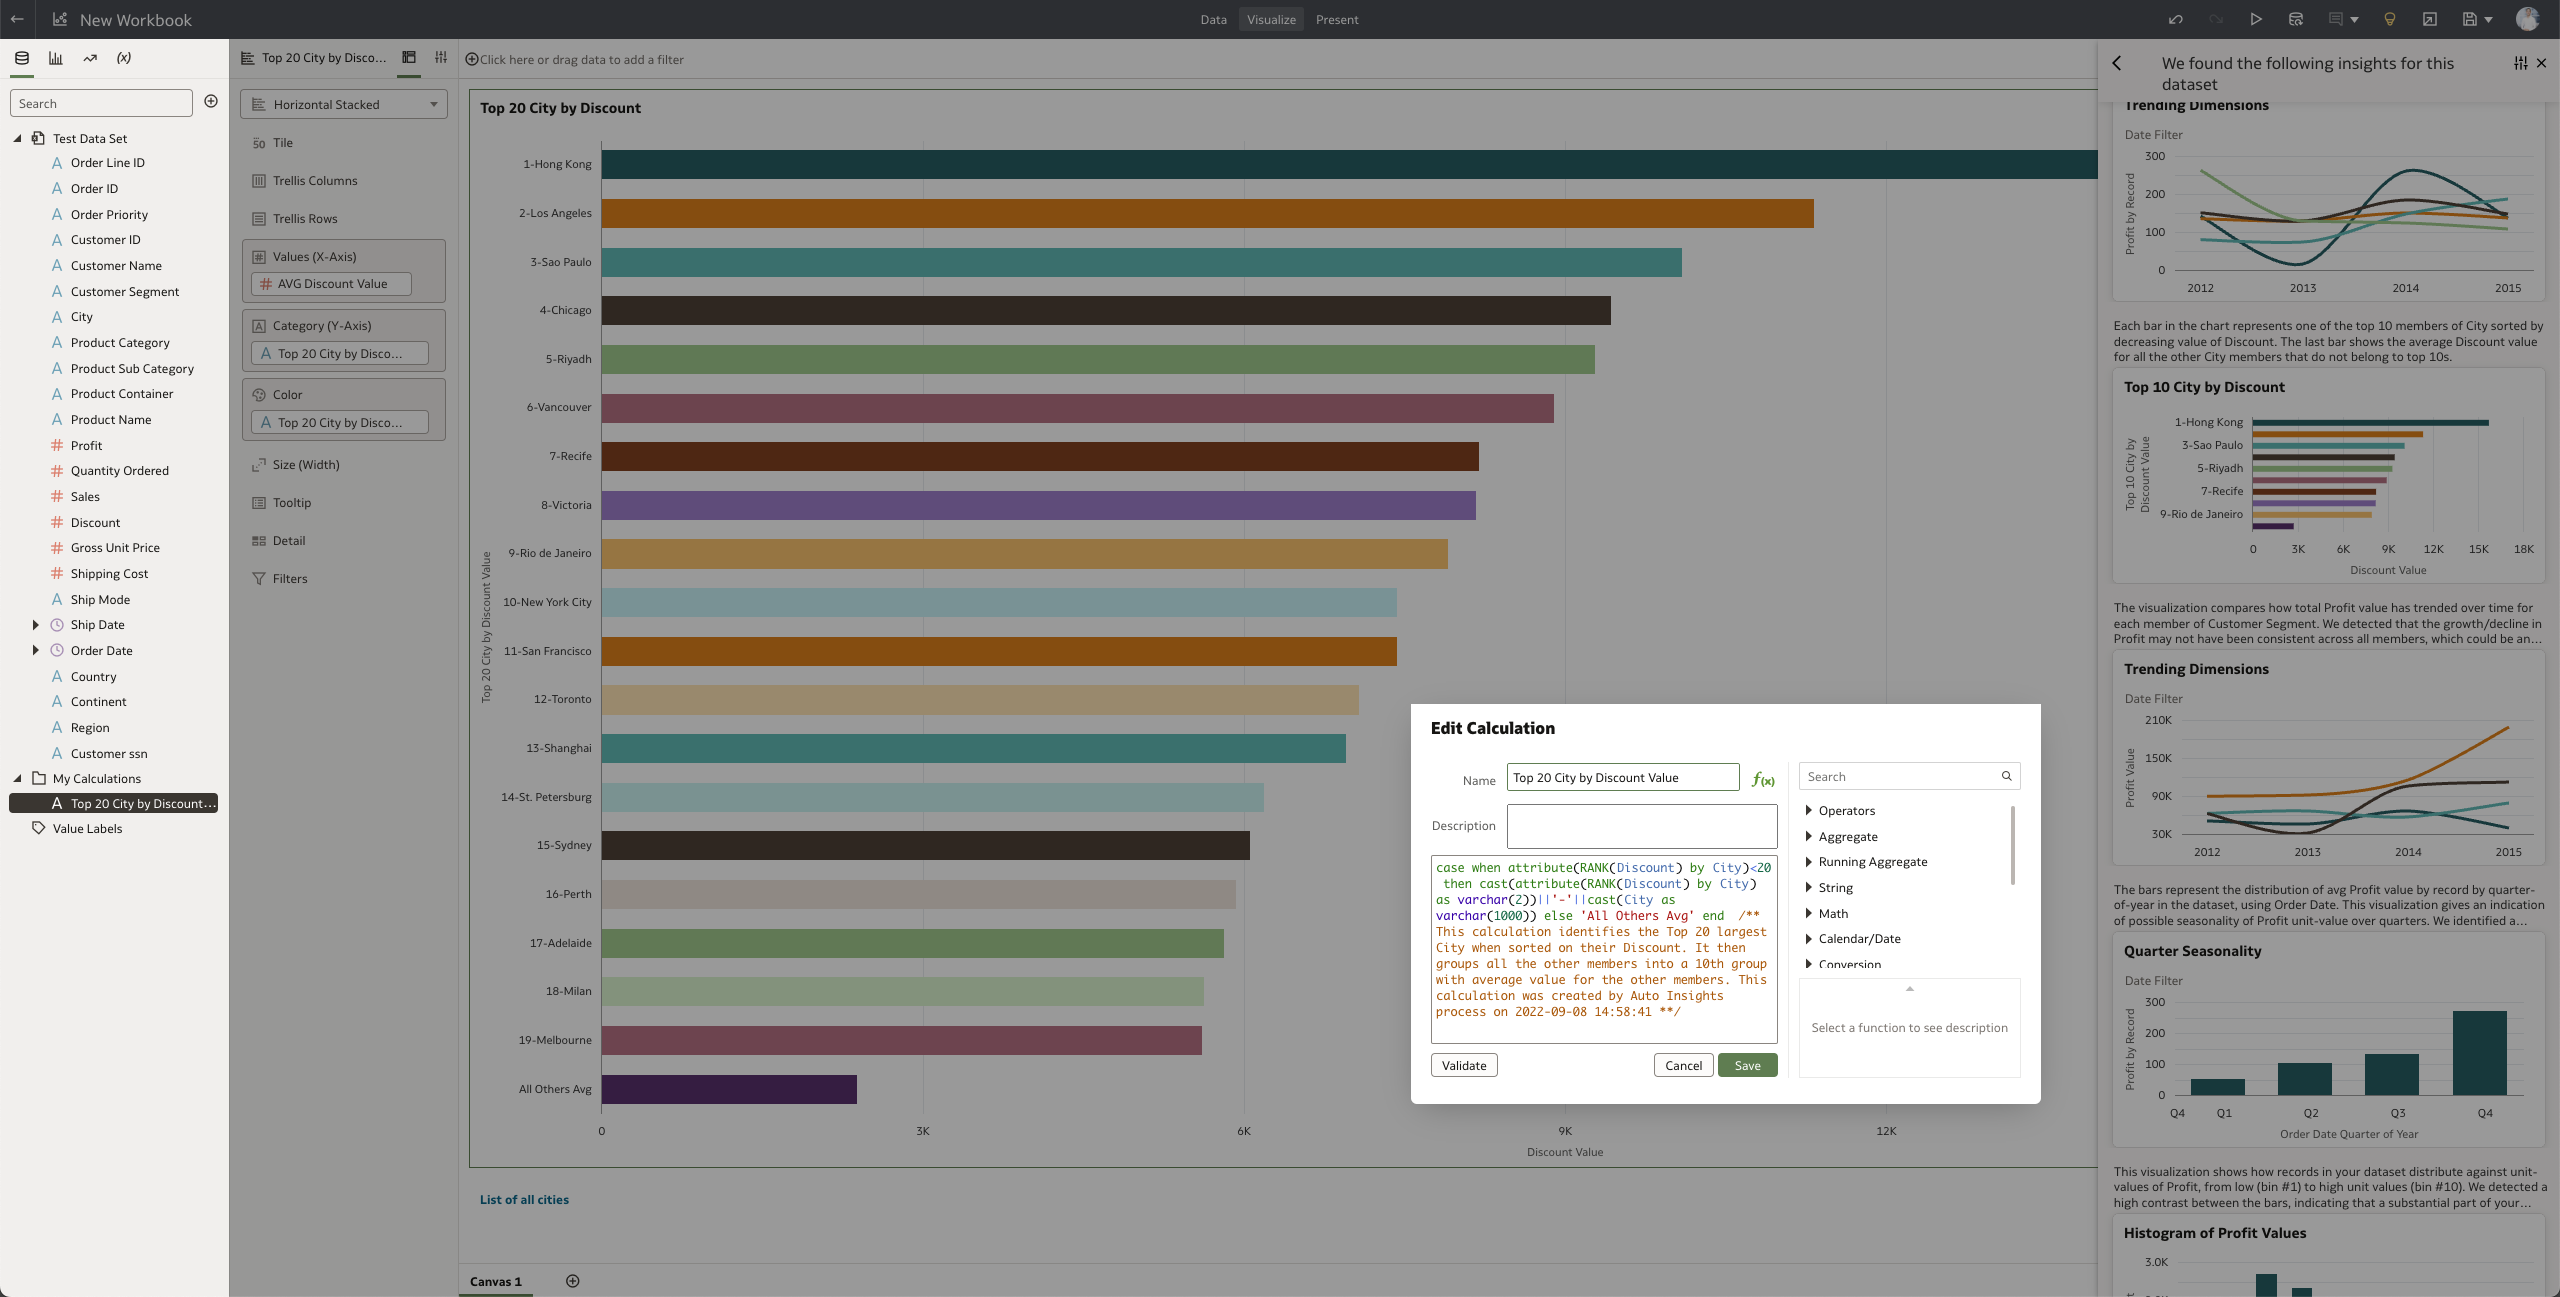
I have a question. I need to create a report on DV side of OAS 6.4. In short, there are many organizations in my list and I need to show top 20 of a defined measure. That's ok. But I want to add one more row at the bottom of this table like 'Others'. Meaning, other than 20 organizations what the total amount of that measure. Is there any possible solution for this need?

Please help me. I am really in trouble with that.

Regards,

Dilek

Best Answer

  • I would also recommend using "Auto-Insights" in DV with your dataset or an Excel dataset if your dataset is a subject area. Auto-Insights will pre-set up some calculations for you including one for the top 20. It will show the first top 9 cities for example and then create an "All Others Avg". You can then make an action link to show the complete list or create a text box below with a link named "More" and add an action link.

    A formula would be like the one below:

    case when attribute(RANK(Discount) by City)<20 then cast(attribute(RANK(Discount) by City) as varchar(2))||'-'||cast(City as varchar(1000)) else 'All Others Avg' end

    /** This calculation identifies the Top 20 largest City when sorted on their Discount. It then groups all the other members into a 10th group with the average value for the other members. This calculation was created by Auto Insights process**/ 

    Screenshot 2023-08-07 at 10.15.50 AM.png


Answers