Hi there,
I am not seeing gauges in the list of visualizations on my Oracle Analytics worksheet. How can I get the gauges to show up for me to use.
Hi @User_JFC05
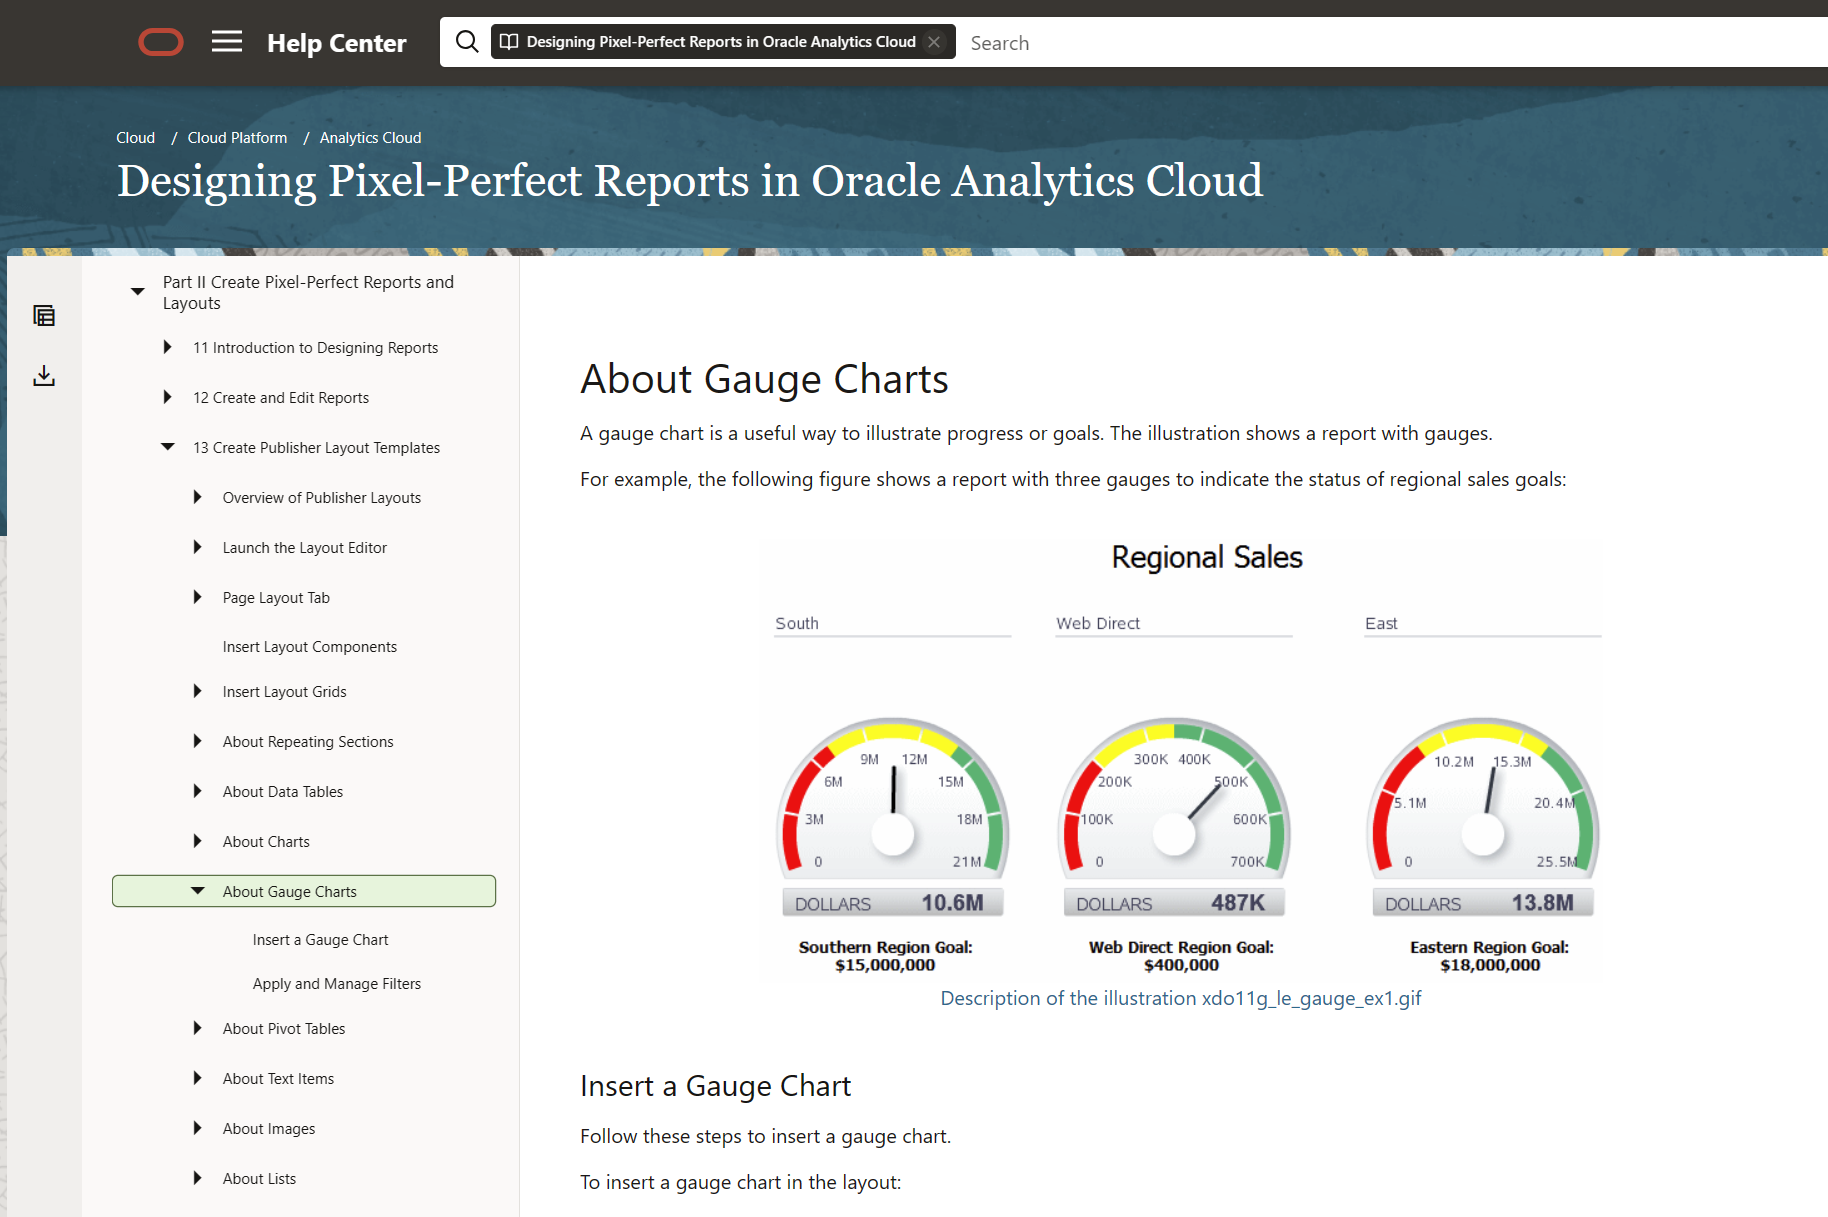
This documentation for BI publisher - Pixel Perfect Reports.Not for DV.
You can try Below extensions..
(128) Import Custom Visualization Extensions in Oracle Analytics Cloud & Server - YouTube
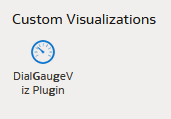
once you imported you can able to see below icon - but we have some limitations.
Please let me know if you need further help.
Regards,
Arjun
We do not communicate on a date but I believe, under safe harbor, that it might be released next year for DV.
Hi, Gauge visualizations are part of the product roadmap and will be available in the near future.
Thank you for the quick response. Do you know when it will be available? Also, the documentation says gauges are available.
Thank you! That answers my question😊
Anyone has any idea why the OAC documentation on custom viz is not available now? I was able to access till last week - https://docs.oracle.com/en/cloud/paas/analytics-cloud/acsdv/build-package-extension.html. Does this mean OAC doesnt support custom viz or custom workbook extensions?
Does Oracle Analytics Server 2026 include AI features such as a built-in chatbot or AI Assistant? If not, are there any plans or indications that these AI capabilities will be introduced in a future OAS release?
Here is my calculation CAST(COUNT(SAAR_ID) AS VARCHAR(50)) || ' SAARs pending as of: ' || CAST(CURRENT_TIMESTAMP(5) AS VARCHAR(50))
In OAC when I am creating a dataset, How can I pass a Filter from the "Dashboard filters to the SQL? I attached a image like it was don in BIP Publisher
How can you put a total number of records in your oracle OAC table footer