Categories
- All Categories
- Oracle Analytics and AI Learning Hub
- 54 Oracle Analytics and AI Sharing Center
- 26 Oracle Analytics and AI Lounge
- 311 Oracle Analytics and AI News
- 57 Oracle Analytics and AI Videos
- 16.4K Oracle Analytics and AI Forums
- 6.7K Oracle Analytics and AI Labs
- Oracle Analytics and AI User Groups
- 117 Oracle Analytics and AI Trainings
- 24 Oracle Analytics and AI Challenge
- Find Partners
- For Partners
How to create a multi-level prompt ?

I am writing to request your assistance in creating a multi-level prompt within OBIEE 19c. I wish to implement a prompt structure with the following functionality:
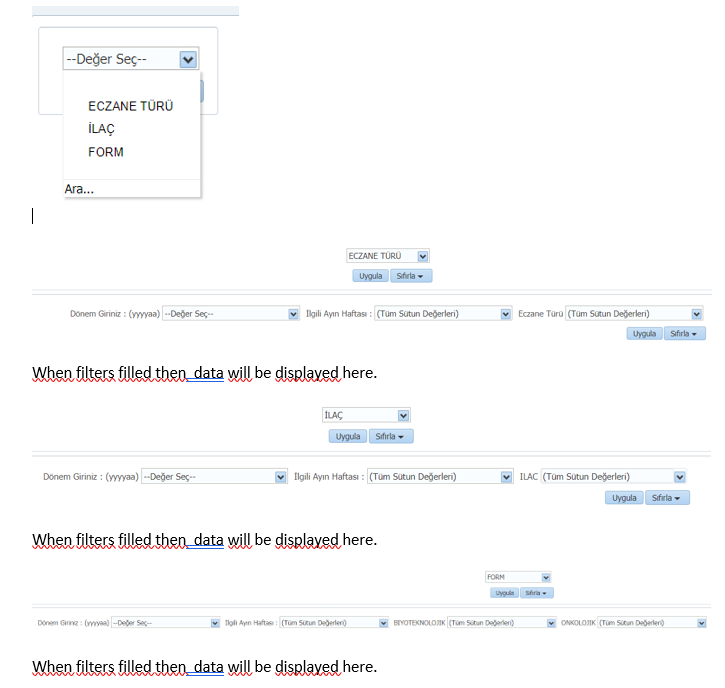
1. Top-Level Prompt:
- This prompt will present three distinct choices, designated as C1, C2, and C3.
2. Sub-Prompts and Filters:
- Upon selecting C1, four individual filters will become visible. Users will then select their desired values for each filter.
- Alternatively, choosing C2 will reveal three separate filters for selection and subsequent data filtering.
3. Data Visualization:
- Once the relevant filters are populated based on the chosen top-level prompt option, the corresponding data will be displayed in the desired format, such as a table, chart, or graph.
Desired Outcome:
I aim to create a user-friendly prompt system that allows for efficient data exploration and analysis based on specific user selections. This multi-level prompt structure should dynamically adapt to the chosen top-level option, presenting the relevant filtering options and subsequently displaying the corresponding data.
Thank you for your time and consideration.
Best Answer
-
Hi @User_XMRBZ ,
OBIEE 19c does not exist, but I would proceed as follows either in 11g or 12c:
- Create a dashboard prompt object to select between C1, C2, and C3 values, and set a presentation variable for it, so you can easily reference the selected value in expressions/filters
- Create a separate dashboard prompt object with all the prompts that must be displayed when C1 has been selected in the top level prompt
- Create a separate dashboard prompt object with all the prompts that must be displayed when C2 has been selected in the top level prompt
- Place each sub-prompt in a separate section in the dashboard, then define a condition on each section to dynamically hide/display it based on the value selected in the top-level prompt
- Follow the same approach for your visualizations: create multiple analyses, place them in separate sections, and use condition to dynamically hide/display them
You can use this old (but still good) presentation I delivered as a reference (slides 30/31): https://speakerdeck.com/barretbse/visualising-data-like-a-top-chef
1

Answers
-
Hi @User_XMRBZ ,
We're thrilled to have you join our community of analytics enthusiasts and professionals. To enhance your experience and foster meaningful interactions, we encourage you to personalize your profile by setting up a display name and uploading a profile picture. Your display name will be how others recognize and engage with you in discussions, while a profile picture adds a personal touch to your forum presence.
There were a few glitches in the past, so if you have an issue configuring your Display Name, see:
A fix for Community display names
As for your issue....
There is no such version as OBIEE 19c, so I will assume that you are using OBIEE 12c (12.2.1.4) since you posted in the OBI forum
For /analytics (classic Dashboards) you can refer to this MOS article
An Example of How To Create A Cascading Contrained Dependent Dashboard Prompt (Doc ID 1573682.1)
The user assistance guides (documentation)
There are also some blogs with examples on the inter webs, but there can be multiple synonyms for this type of prompt (cascading, contrained, inline, multilevel, etc.)
As far as data visualization (/dv) goes, OBI 12c has a very rudimentary version (that is where it all started with version 12.2.1.2)
Hoever, in classic analysis/dashboards there are many charting types available.
Oracle Analytics Cloud (OAC) has the most advanced features related to prompting and binding variables.
Oracle Analytics Server (OA) on-prem will be next. It is updated annually with the available OAC features at the time. The next expected release is OAS 2024 (estimated sometime in March 2024.. safe harbor).
I hope that points you in the right direction.
Other comments, welcomed.
0 -
Hi,
Could you please provide the full name and version of the product you are asking about?
There isn't an OBIEE 19c, therefore it quite tricky to guess what part of the product (assuming it is the Oracle Analytics family) you are asking about: "classic" dashboard/analysis, DV workbooks, Publisher?
0 -
Thanks for your responses. I am a newbie. Sorry for confusion. It is 12 c. And i added a document to clarify what i mean.
0 -
Hi @User_XMRBZ ,
I believe that nobody is willing to open a
docxfile found on a forum. I suggest you to export it as a PDF and then share it again! 😉1 -
Hope this helps. By the way what is the name of this kind of prompt? (multi-level, hierarchical , cascading etc.)
0 -
Hi @User_XMRBZ ,
It helps!
You can follow the procedure illustrated in my first reply to achieve your goal. You need to build a separate dashboard prompt objects for each different set of columns that you want to present to your end-users, and then use conditions to dynamically show/hide them. You also need to set a presentation variable with the value selected in the top-level prompt.
I don't think that this kind of prompt have a particular name, but I would call them conditional prompts.
2 -
Thank you @Federico Venturin . Will try.
0 -
In the documentation link, I posted above, they are called 'Constrained Prompts', but there can be different synonyms based on on languages, and even from using other analytics products.
You described it well in your initial post, and subsequent posts for the community to understand it.
Don't forget to update your profile/name, so we can all converse and refer to you by your given name.
0

