Organization Name (Required - If you are an Oracle Partner, please provide the organization you are logging the idea on behalf of): Oracle
Description (Required): HEXBIN Visualization
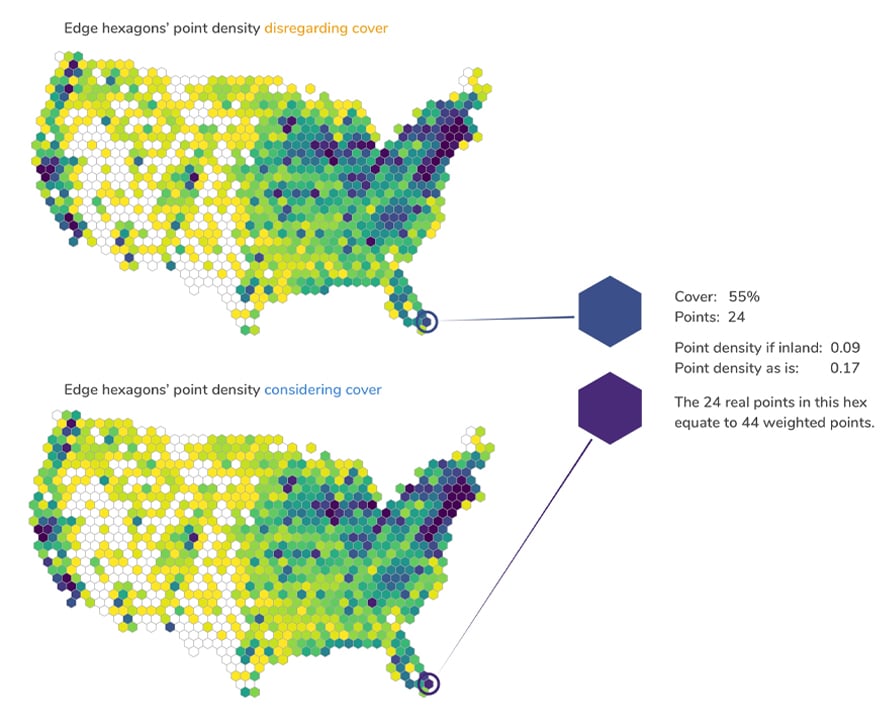
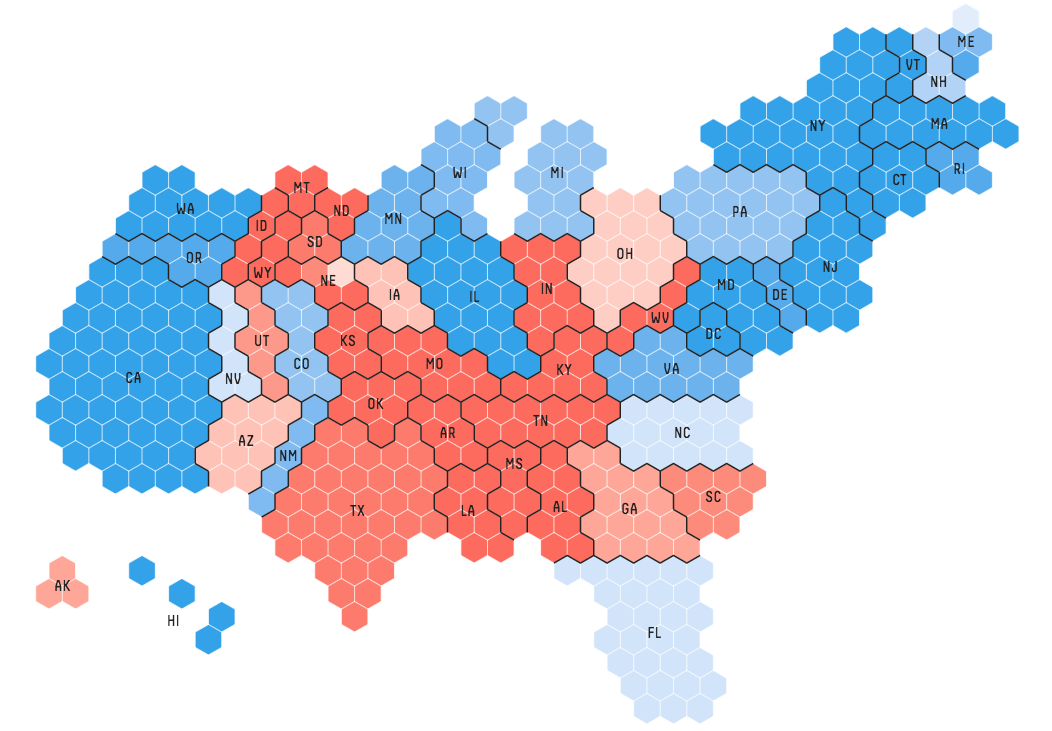
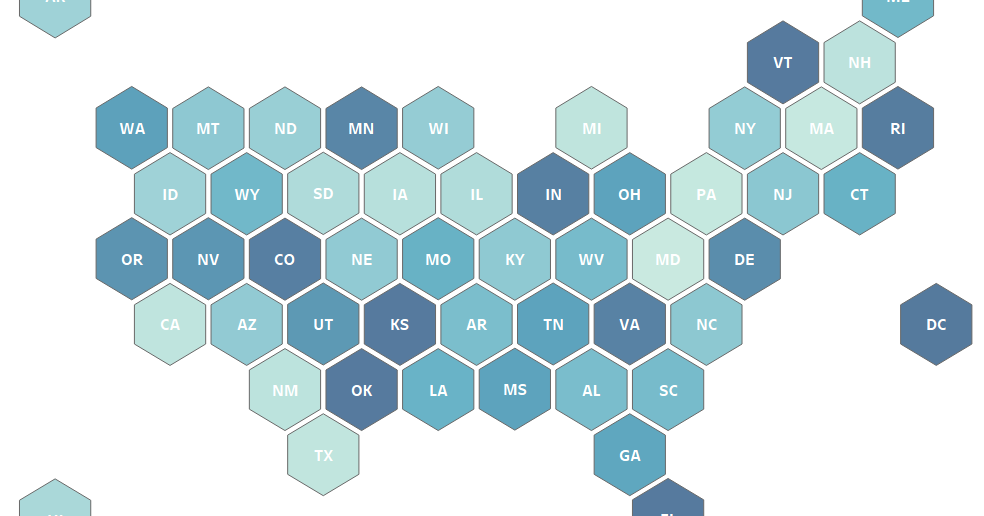
Hexagon Binning data visualization is a visual based obviously on hexagons.
These hexagons can be representative of different values (e.g. size and color) and can be used on cartesian plane or better on maps.
Examples here:
More examples here:
https://think.design/services/data-visualization-data-design/hexbin/
https://www.flerlagetwins.com/2018/11/what-hex-brief-history-of-hex_68.html
https://stackoverflow.com/questions/67017660/how-to-create-a-hexagonal-heat-map-using-matplotlibor-other-lib-tool
Use Case and Business Need (Required): Hexbinning is a new DV technique that is becoming very popular and adopted in different products
Enhancement Request / Service Request: