Oracle Analytics Cloud and Server

Welcome to the Oracle Analytics Community: Please complete your User Profile and upload your Profile Picture

How dose OAS search the logical query when run a report

Received Response
44
Views
3
Comments

We are encountering performance issue after migration from OBI 12c to OAS.

I traced a report by adding 'set variable LOGLEVEL=5' to the Prefix section on the Advanced tab, and view the log in the active sessions.

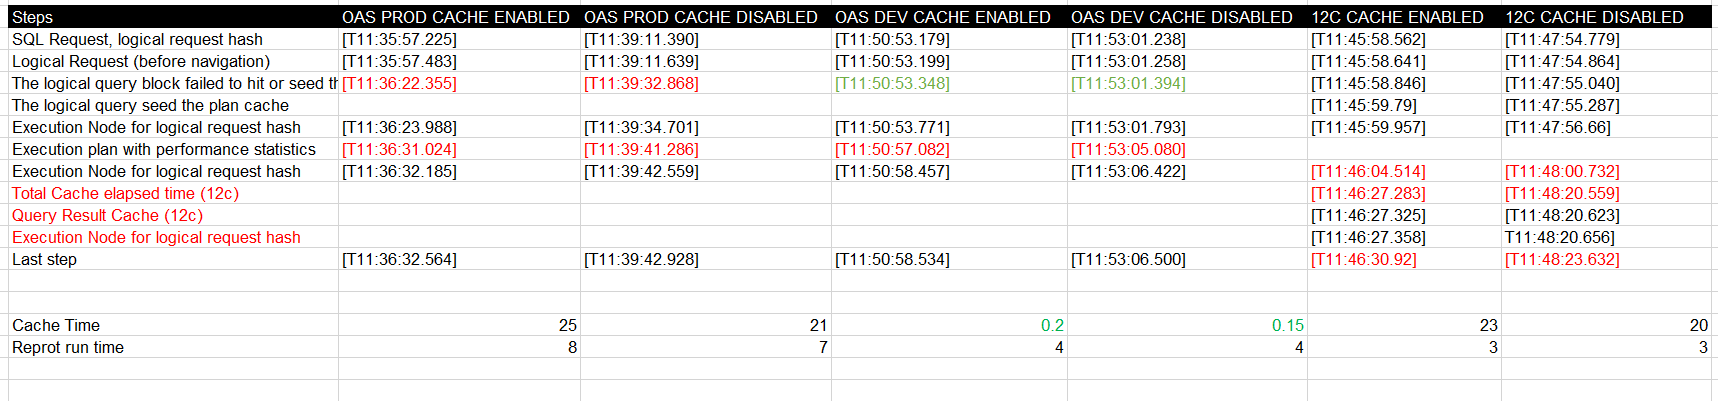
I found it takes long time between step Logical Request (before navigation) and plan RqList. Same report in different environments takes different time. It is longer in PROD than in DEV.

It looks like the server search the logical query from somewhere but failed to hit.

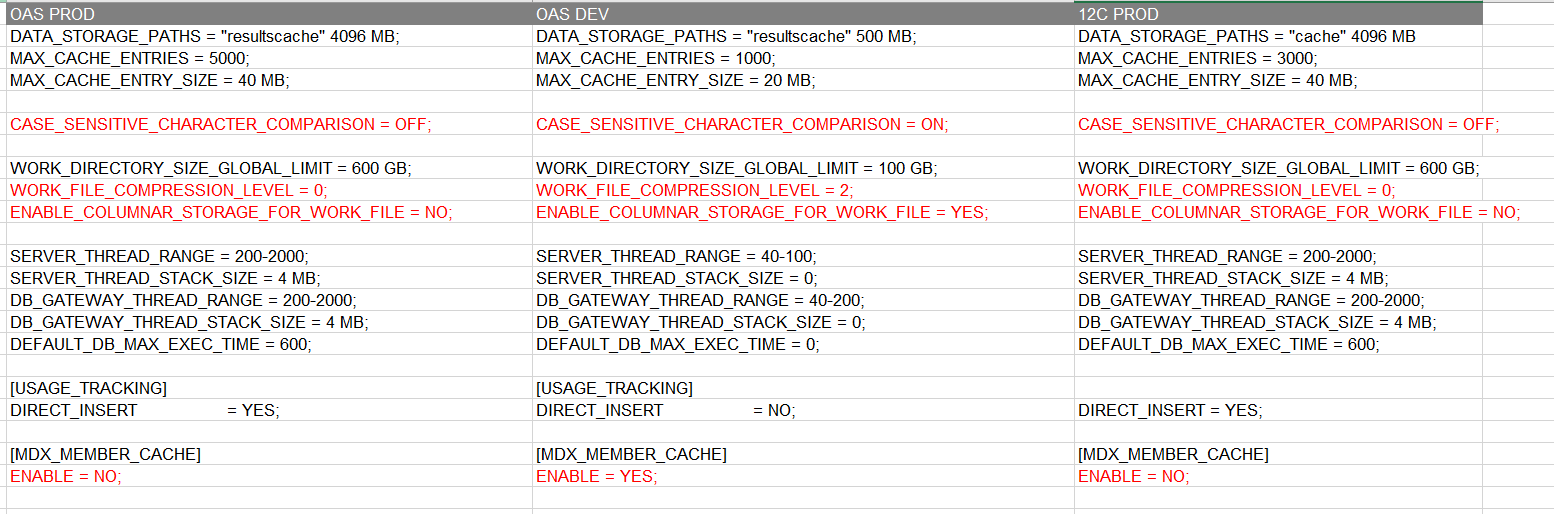
The prod has 3 nodes cluster. The physical table are not cacheable. The Cache is enabled.

My questions are:

First, how the logical query is searching, from memory, cache or database? Why it takes long time?

Second, will disable the cache avoid the searching step?

Third, how can we improve the searching time for the logical query.

The simplified trace log attached.

Thanks,

Mei

Answers

  • Hi

    YOu could try to test the report by disabling cache at report level. In Advanced tab add the following to prefix section : SET VARIABLE OBIS_REFRESH_CACHE=1 and see if the performance is better.

    Thanks

    Gayathri

  • SteveF-Oracle
    edited Apr 11, 2024 3:37PM

    Hi Mei - @User_RI5LY,

    In addition to the prior response.

    Please update your profile display name, so we know with whom we are interacting with.

    [2024-04-04T14:33:18.594-04:00] [ Physical Query Summary Stats: Number of physical queries 4, Cumulative time 1.349, DB-connect time 0.000 (seconds)[2024-04-04T14:33:18.597-04:00] Number of joins executed internally for logical request hash 43adfd3f :[2024-04-04T14:33:18.601-04:00] Number of temp files generated internally for this logical request hash 43adfd3f : 0 . Temporary file info: no temp file[2024-04-04T14:33:18.604-04:00]  Number of aggregates generated internally for logical request hash 43adfd3f : 9. Aggregates info: Sort-Aggregation: 0, HashGroupBy: 0, Traditional: 9[2024-04-04T14:33:18.608-04:00]  Rows returned to Client 25866[2024-04-04T14:33:18.611-04:00]  Logical Query Summary Stats: Elapsed time 61.595, Total time in BI Server 60.840, Execution time 60.524, Response time 60.675, Compilation time 55.579 (seconds), logical request hash 43adfd3f [2024-04-04T14:33:18.614-04:00] Num of Result Cache Hit:0, Num of XSA Cache Hit:0.
    

    Per the log, there is quite a bit of time spent in the BI Server (nqsserver), this can indicate that some processing may not be function shipped or pushed to the datasource; wherein, in 12c it may have been, or some processing (joins, aggregations, etc.).

    You mention that you "migrated" from OBI 12c to OAS.

    Was this an in-place upgrade, or did you perform an out-of-place migration?

    If the latter, I assume you are using the same metadata (RPD), and it has not changed?
    Is the NQSConfig.INI the same?
    Have you check the OAS console, for any different configuration

    Do you have the same log from OBI 12c?

  • Betty.ca
    Betty.ca Rank 3 - Community Apprentice

    Thank you @GayathriAnand-Oracle and @SteveF-Oracle for your help.

    I have tracked same report with two options, with and without SET VARIABLE OBIS_REFRESH_CACHE=1 in the Prefix section in OAS PROD, OAS DEV and 12C PROD environments.

    We migrated to OAS in new VMs with same  metadata (RPD). In 12c PROD the physical table is cacheable and not in OAS PROD.

    I compared the significant time between the steps I found the most difference is that the cache time in OAS DEV is much smaller than those in PROD.

    Detail shown below;

    image.png

    I compared the  NQSConfig.INI they are some differences.

    image.png

    I think CASE_SENSITIVE_CHARACTER_COMPARISON caused the slow cache elapsed time. Not sure WORK_FILE_COMPRESSION_LEVEL has affect to the slowness either.

    Do you have any other suggestions?

    Thanks,

    Mei