Oracle Analytics Cloud and Server

Welcome to the Oracle Analytics Community: Please complete your User Profile and upload your Profile Picture

Exclude option in Dashboard filter giving strange results.

Accepted answer
131
Views
17
Comments

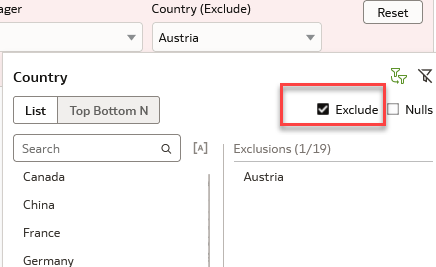
Exclude option in Dashboard filter giving strange results after May 2024 updates. Does anyone come across it?

For example Total is 500. When Select Austria , it shows 45 which is correct. But If I check Exclude Button, it is giving 500 or some other strange value than 455.

image.png

Best Answer

  • Sumanth V -Oracle
    Sumanth V -Oracle Rank 8 - Analytics Strategist
    Answer ✓

    @Rajakumar Burra - This issue has been identified as an internal bug and is currently being addressed in the SR created for this matter. We will inform you on the SR as soon as the bug is fixed. Thanks.

«1

Answers

  • The only thing that matter is the query generated: what do the queries looks like (LSQL and physical SQL if any) with and without the filter? That will explain the number you get, and will also be quite explicit if the filter behave weirdly or not (your data and your logic could be the one giving that behavior).

  • Sarah Beckwith-Oracle
    Sarah Beckwith-Oracle Rank 2 - Community Beginner

    @Gianni Ceresa, How do you determine what the generated query is in Oracle Analytics Desktop?

  • KhaderBelgoud-Oracle
    KhaderBelgoud-Oracle Rank 4 - Community Specialist

    @Rajakumar Burra I have verified in the test instance and the Dashboard filter are working as expected. If you are still finding any differences then you may validate the SQL generated

  • Rajakumar Burra
    Rajakumar Burra Rank 6 - Analytics Lead

    I have two Pie charts in same canvas. Both are giving different results. It was working fine before May 2024 updates.

    Their SQL is as below.

    Fetching 2321 which is wrong.

    SELECT
    0 s_0,
    CAST(NULL AS DOUBLE) s_1,
    XSA('xyz@ptc.com'.'PMO Reports')."Columns"."Work Type" s_2,
    SUM(XSA('xyz@ptc.com'.'PMO Reports')."Columns"."Capacity Allocation")/(100*COUNT(DISTINCT XSA('xyz@ptc.com'.'PMO Reports')."Columns"."Month")) s_3
    FROM XSA('xyz@ptc.com'.'PMO Reports')
    WHERE
    ((XSA('xyz@ptc.com'.'PMO Reports')."Columns"."FYQ" = 'FY24 Q3') AND (XSA('xyz@ptc.com'.'PMO Reports')."Columns"."Duration" = 'MAY24') AND (XSA('xyz@ptc.com'.'PMO Reports')."Columns"."Emp Type" = 'PTC Full Time') AND ((XSA('xyz@ptc.com'.'PMO Reports')."Columns"."Segment Portfolio" <> 'ALM') OR (XSA('xyz@ptc.com'.'PMO Reports')."Columns"."Segment Portfolio" IS NULL)))
    FETCH FIRST 1000001 ROWS ONLY

    Below Pie Chart SQL Fetching 2108, which is correct.

    SELECT
    0 s_0,
    CAST(NULL AS DOUBLE) s_1,
    XSA('xyz@ptc.com'.'PMO Reports')."Columns"."Portfolio Level" s_2,
    SUM(XSA('xyz@ptc.com'.'PMO Reports')."Columns"."Capacity Allocation")/(100*COUNT(DISTINCT XSA('xyz@ptc.com'.'PMO Reports')."Columns"."Month")) s_3
    FROM XSA('xyz@ptc.com'.'PMO Reports')
    WHERE
    ((XSA('xyz@ptc.com'.'PMO Reports')."Columns"."FYQ" = 'FY24 Q3') AND (XSA('xyz@ptc.com'.'PMO Reports')."Columns"."Duration" = 'MAY24') AND (XSA('xyz@ptc.com'.'PMO Reports')."Columns"."Emp Type" = 'PTC Full Time') AND ((XSA('xyz@ptc.com'.'PMO Reports')."Columns"."Segment Portfolio" <> 'ALM') OR (XSA('xyz@ptc.com'.'PMO Reports')."Columns"."Segment Portfolio" IS NULL)))
    FETCH FIRST 1000001 ROWS ONLY

  • Rajakumar Burra
    Rajakumar Burra Rank 6 - Analytics Lead

    Images below:

    image.png image.png image.png
  • Gianni Ceresa
    edited Jun 19, 2024 7:28AM

    @Rajakumar Burra , you should compare the queries generated with an include and with an exclude filter but for the same visualization, the one that isn't behaving correctly. The point is to identify how did the different query generated influence the analysis, to identify the reason of the "wrong" (based on your expectations) calculation.

    Because your visualization has a number of conditions, it's possible that when you exclude a value, the query generated is going to bypass some of the conditions you wrote, retrieving a different set of records than what you have in mind.

  • Rajakumar Burra
    Rajakumar Burra Rank 6 - Analytics Lead

    @Gianni Ceresa Thanks for quick reply. Logical SQL showing same filters both.

    Problem is coming with Exclude option only. If we uncheck exclude, it works fine.

    This is not new Workbook. It is old. It was working fine. Seems something is broken in May 2024 updates.

  • Rajakumar Burra
    Rajakumar Burra Rank 6 - Analytics Lead

    Just compared the LSQL.

    When we exclude the values, it is automatically adding with OR

    OR (XSA('xyz@ptc.com'.'PMO Reports')."Columns"."Segment Portfolio" IS NULL))) . Seems it is causing problem.

    Also if we explicitly uncheck the Nulls button it is adding

    AND (XSA('xyz@ptc.com'.'PMO Reports')."Columns"."Segment Portfolio" IS NOT NULL))).

    It is giving correct results.

  • Gianni Ceresa
    edited Jun 19, 2024 8:35AM

    @Sarah Beckwith-Oracle , OAD isn't really the product of this thread (OP is using OAC), but OAD is just a "lightweight" OAS running on your desktop.

    The usual log files exist, for example in C:\Users\<your user>\AppData\Local\Temp\DVDesktop\logs\OBIS you can find obis1-query.log that does contains queries etc.