Categories
- All Categories
- 15 Oracle Analytics Sharing Center
- 14 Oracle Analytics Lounge
- 213 Oracle Analytics News
- 42 Oracle Analytics Videos
- 15.7K Oracle Analytics Forums
- 6.1K Oracle Analytics Idea Labs
- Oracle Analytics User Groups
- 78 Oracle Analytics Trainings
- 14 Oracle Analytics Data Visualizations Challenge
- Find Partners
- For Partners
Of having different aggregations in horizontal bars of a butterfly chart

Hello,
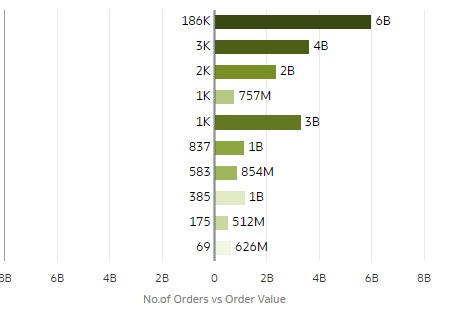
I have a butterfly chart below that shows Number of Orders vs Order Value per Product ( I have not shown product for privacy). The Number of Orders are in the hundreds of thousands and the Order Value in the billions. So:
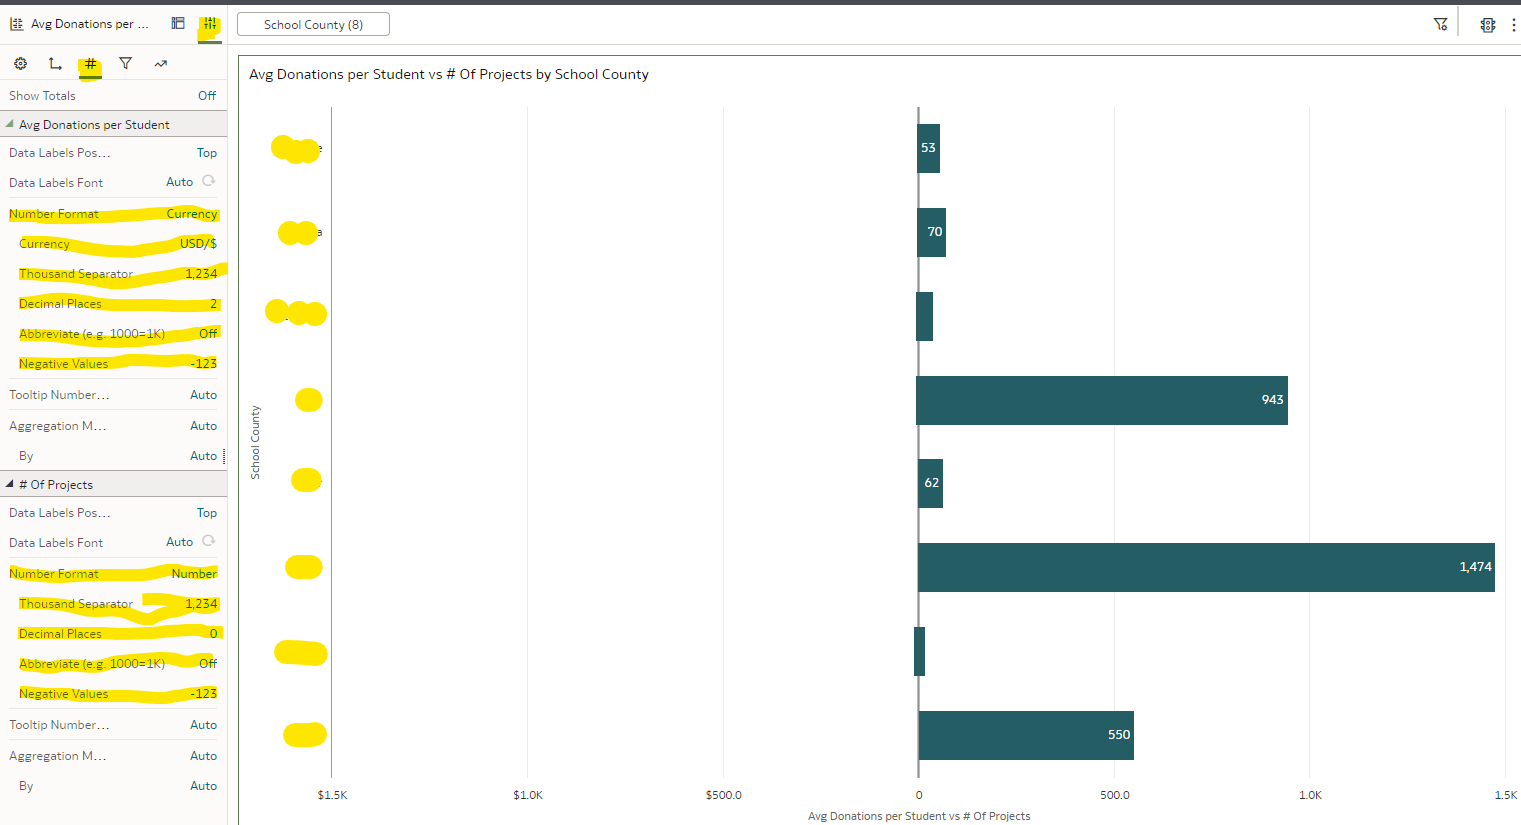
1. I wish to have the Number of Order to have NO aggregation (e.g. instead of 186K to show 186,093) and the Order Value to show an aggregation of millions (e.g. instead of 6B to show 5,900M). How do I do this?
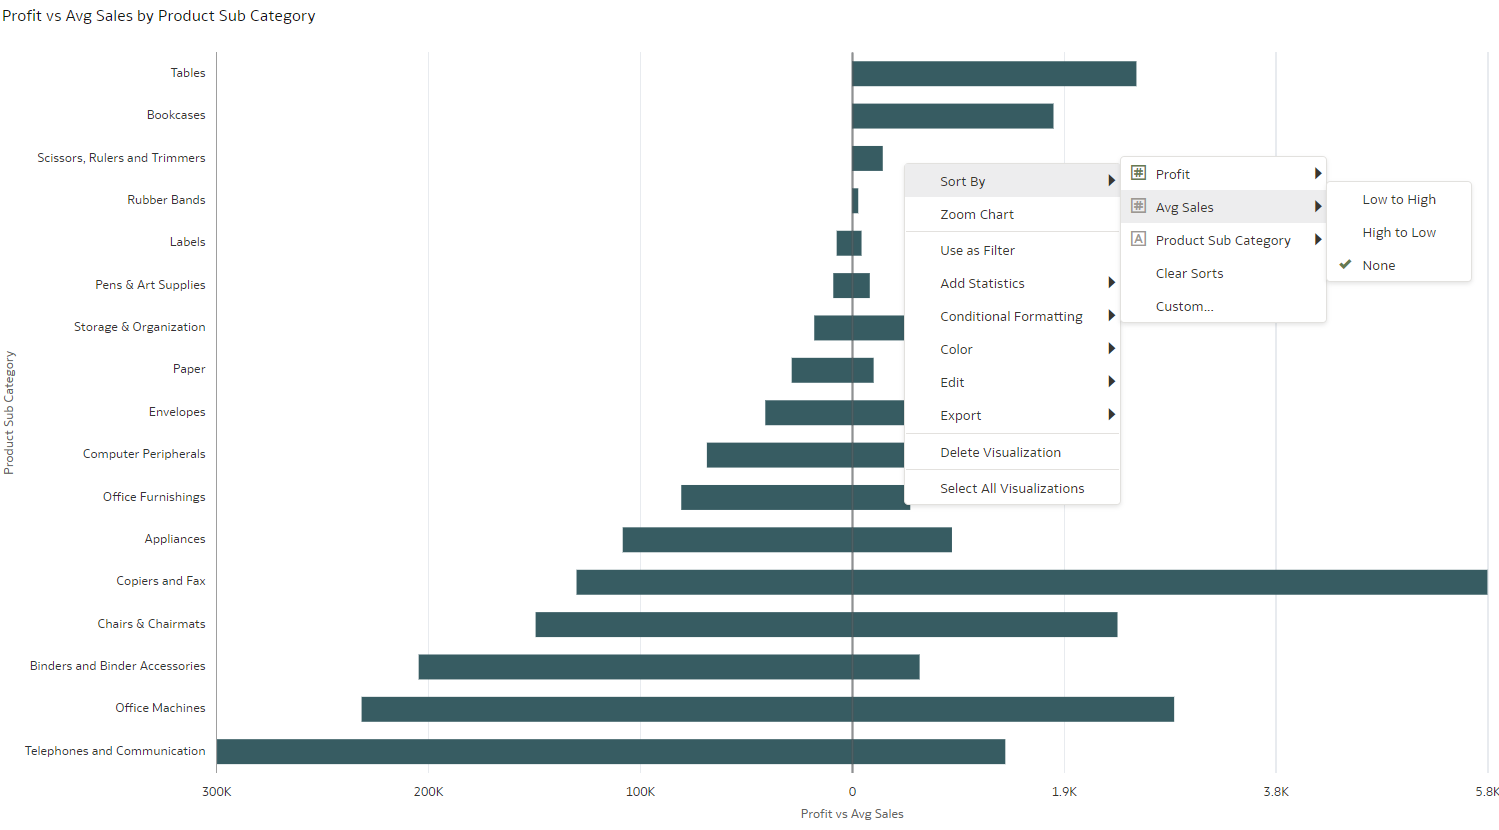
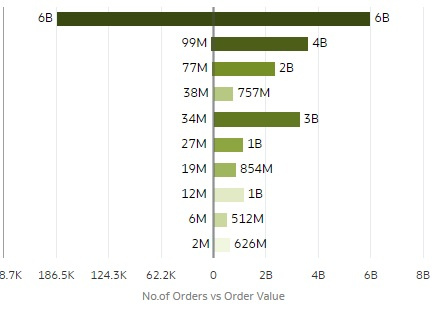
2. I would also like to show the horizontal bars for the Number of Orders. The way I would do this ( I think ) is by setting Synchronize Scales to OFF. But this is really distorting the Number of Orders figures (see below). What am I doing wrong, or how do I un-synchronize the Number of Orders from the Order Value?
Thank you.
Answers
-
@Mirithu Regarding your requirement #1 , please check if the settings below help.
Regards,
Bala.0 -
Hi @BalagurunathanBagavathy-Oracle
Thank you for your response but still not working.
0 -
Hi @Mirithu have you tried right clicking the chart and selecting the sort by metric ? that should work, let us know. Tks
0 -
Thank you for your assistance. The sort was already in place (High to Low), so only option is to Clear Sorts, whose net effect is just that. No change in the horizontal bars.
I will just have to change the viz.
Thank you.1