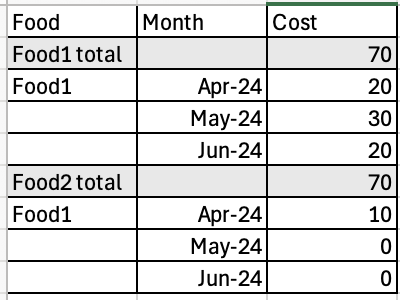
I need the subtotal row to appear first before the other calculations. Here's an example of how I want it to be positioned:
Is there a feature in Data Visualization that can handle this requirement?
Hi @Rashmi Jadhav-Oracle ,
In Data Visualization, you have to use a Pivot visualisation. In the Properties panel, select the Totals tab, and change the Total Rows Position property to Above.
You can change the background color from the Properties panel > Edge Labels tab > Header Font (you have to do it for each column). As an alternative you can set a custom background color for everything in the visualisation: Properties panel > General tab > expand Style and set Background to Custom
Thanks, @Federico Venturin! Your approach worked, but the Pivot visualization is highlighting a column that I want to avoid. Is there a way to prevent this column from being highlighted?
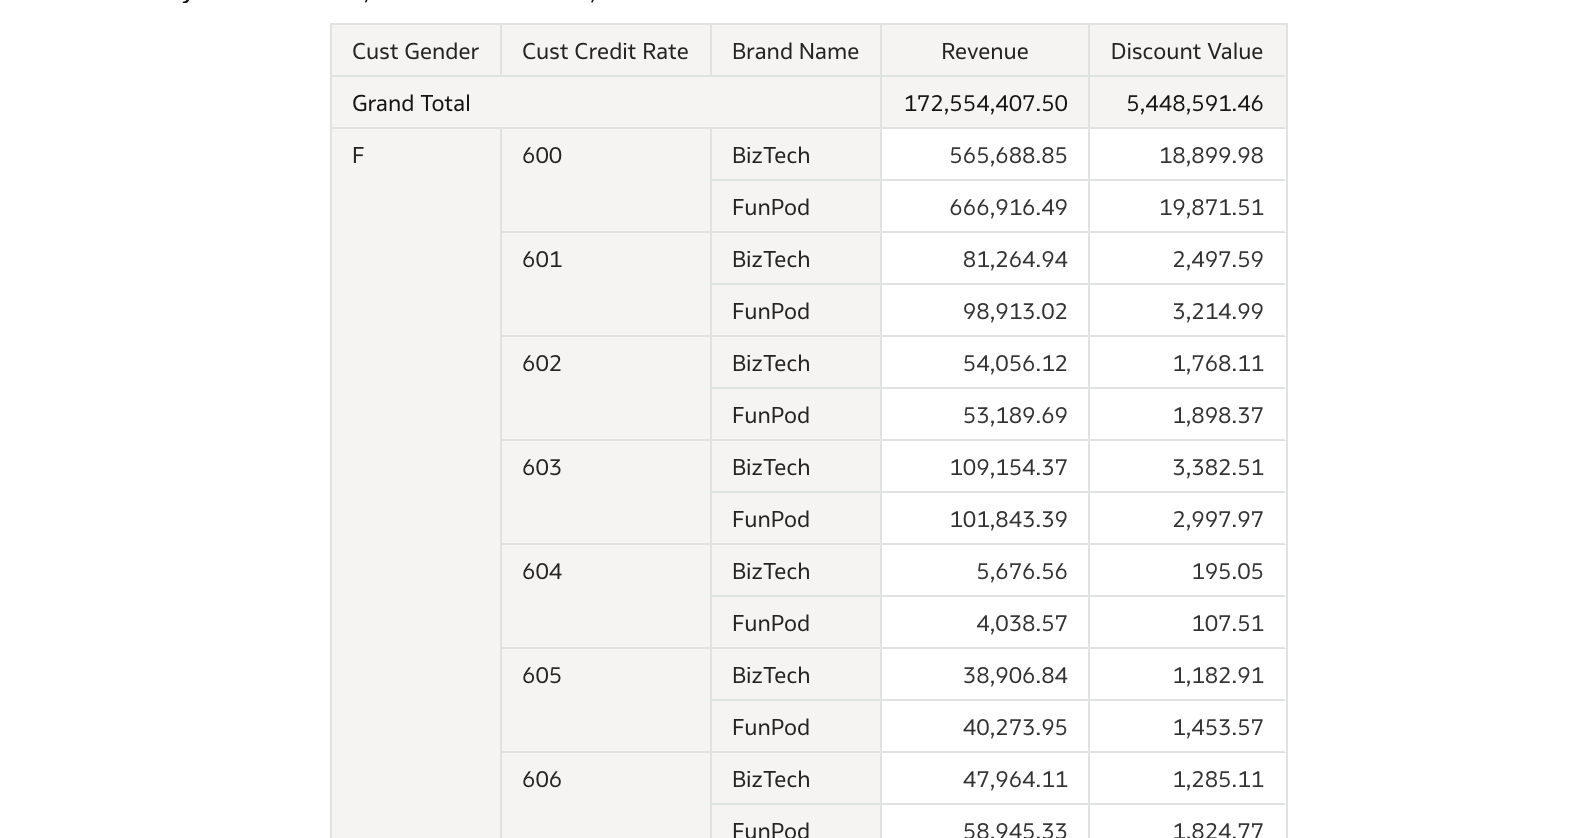
Alternatively, if it's not possible to adjust the subtotal, can I move the grand total to the top in the table visualization?
@Rashmi Jadhav-Oracle - Yes, grand total can be moved to the top of visualization and it will look as below:
Thanks.
Sumanth V -Oracle, Is the screenshot you shared from a pivot table visual?
Do you know how to prevent one of the columns from being highlighted? We only have three columns, and highlighting two columns doesn't look good. Any thoughts on how to fix this?
@Rashmi Jadhav-Oracle , you seem to be working with a DV workbook (always better to say, when you ask a question, which part of the product you are using: DV workbook, "classic" analysis or Publisher report, and also what product: OAC or OAS as they have different features).
Some features that exists for more than 10 years in "classic" analyses aren't available in DV workbooks, like saying to show totals on top in a table view. Using a pivot as posted by Federico is a workaround, and comes with some downside you can try to fix (like the column highlight, but changing the color of those columns is then another workaround).
You can also post ideas in https://community.oracle.com/products/oracleanalytics/categories/idealab-oracle-analytics-cloud-server requesting that option to be added. It shouldn't take long to implement, and I'm not really sure why such basic things are missing.
@Sumanth V -Oracle , sorry but you post a screenshot of a pivot, which is what was said in the reply just before with OP mentioning the downside of the background coloring. If you are still positive that for a table (NOT a pivot) the option is there, then you should be using a special version of the product that nobody else has.
@Gianni Ceresa - Yes, it's from Pivot view only showing how the grand total looks based on OP's comments, I even marked 'Agree' on that comment, just that it over lapped with Rashmi's update. You can see it's almost at the same time. Thanks.
Description: The Oracle Fusion Data Intelligence (FDI) Product Roadmap Update provides an overview of the latest developments and future plans for FDI. Oracle Product Management experts will share upcoming capabilities, key enhancements, and product direction, helping attendees understand what is changing and how these…
I'm trying to index a Local Subject Area so I can use it in my AI Agent, however, I keep receiving the generic error below. Request status(500) : error = {"prefix":"DSS","code":50000,"message":"There was an unexpected error while processing this request. Please try again."}
it is observed that in OAC while using case statements the output is not expected.For example if we have a case statment like case when table1.column1=table2.column1 then 'yes' else 'No' end as Attribute1 Now if i use this attribute with a fact-amount column attribute 1|| Amount on a report then we dont get the aggregation…
Once I select that value from the list box Region I created, I want to filter the table by my selection. See the images
Hi, While using OAS or OAC latest version can we generate a report to view complete defition of semantic model/subject area. It helps to document and troubleshoot. thanks