Categories
- All Categories
- 15 Oracle Analytics Sharing Center
- 14 Oracle Analytics Lounge
- 213 Oracle Analytics News
- 42 Oracle Analytics Videos
- 15.7K Oracle Analytics Forums
- 6.1K Oracle Analytics Idea Labs
- Oracle Analytics User Groups
- 78 Oracle Analytics Trainings
- 14 Oracle Analytics Data Visualizations Challenge
- Find Partners
- For Partners
How to speed up performance metrics streaming time?

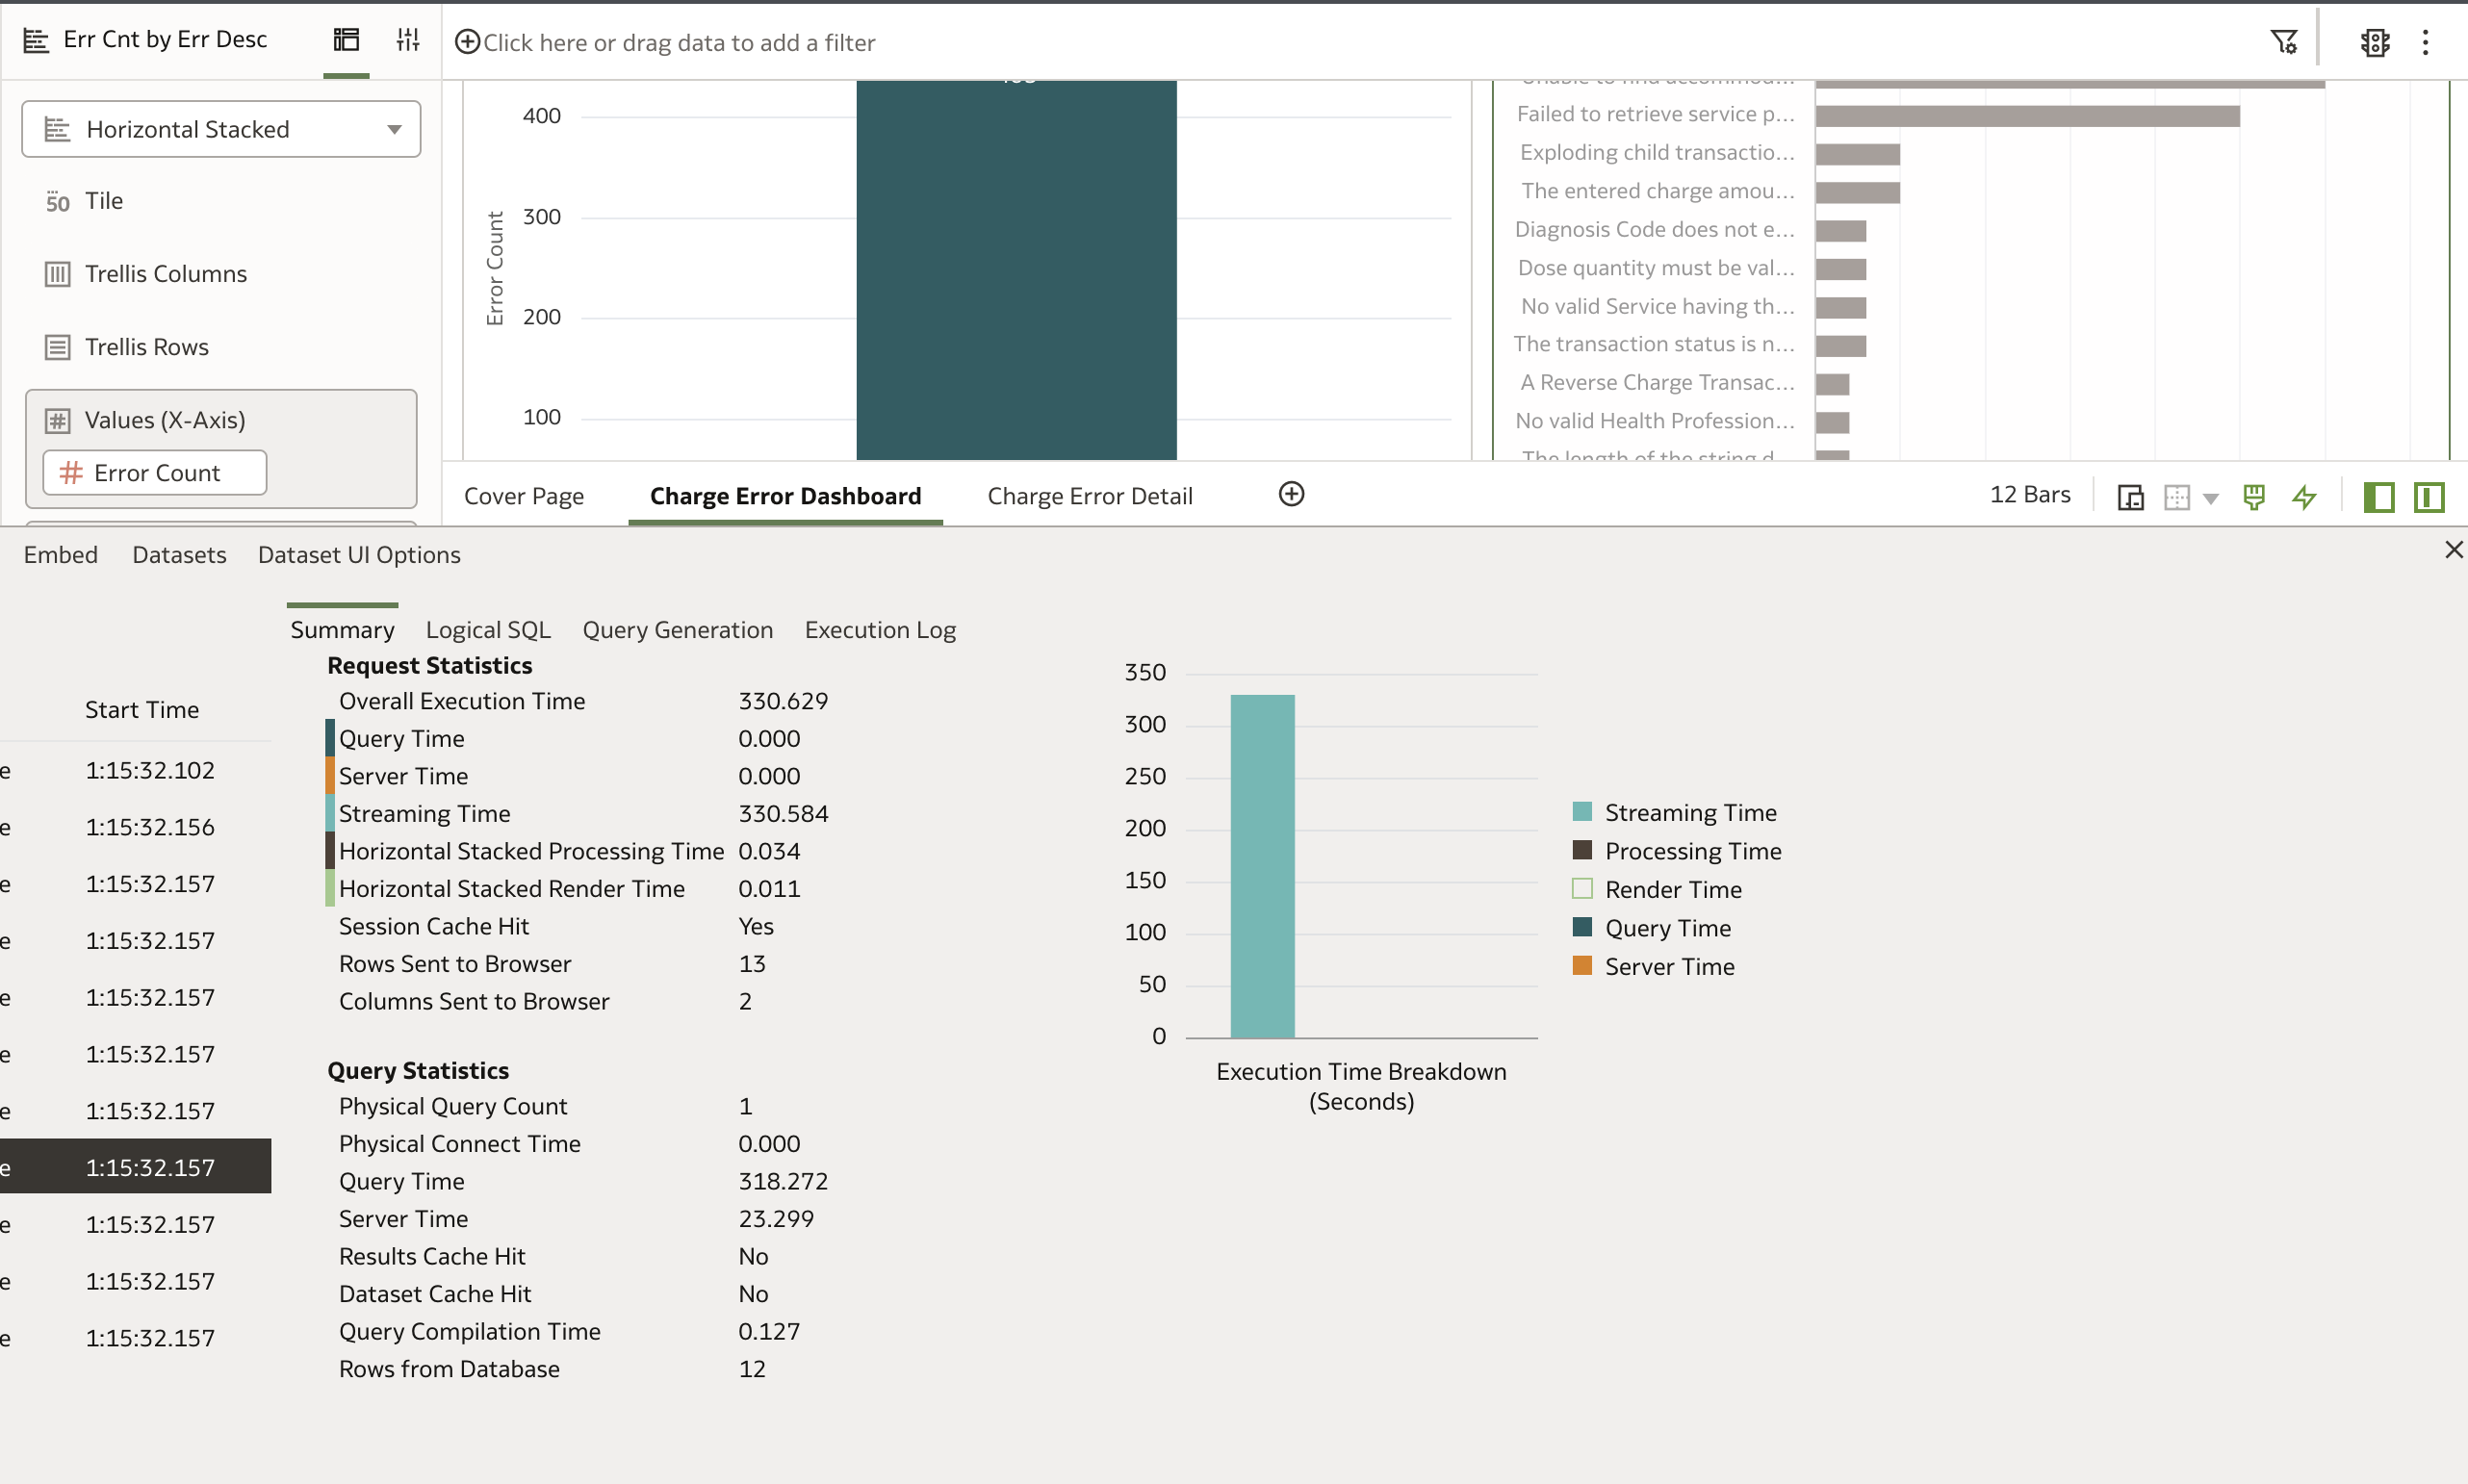
I am trying to get a better understanding of the performance metrics test in OAC. After we moved all the workbook calculations to my database view, my workbook is very slow. Ideally, since we moved all the case when calculations to the table view it was supposed to perform better. I am trying to understand what I can do to enhance its performance. at the moment streaming time is taking longer than it should, is there anything I can do to reduce the streaming time?
Best Answers
-
Hi @User_SFA90 ,
Which object are you using to access to your data? A subject area? A dataset?
Where is data stored? In OCI? on-premise?
Are you using a view or a materialized view? How many calculations do you have in it?
Have you tried to run the physical SQL code generated by OAC directly in the database? Does it run faster?
1 -
since we moved all the case when calculations to the table view it was supposed to perform better
What made you believe this?
If your CASE WHEN instead of being in the workbook or dataset is in the view, the real query executed by your database is probably pretty much the same: a view doesn't materialize anything, it just hide a query behind a "table-like" object. If you do use a materialized view or a table, there you should see a real difference (in case the slowness was due to the CASE WHEN logic in your queries).
If a workbook takes more than 5 minutes, you should easily be able to identify what is really happening when you execute it, where these 5 minutes are really spent.
With a query time of more than 5 minutes and just 12 rows returned from your database, if you want to improve performance, you maybe need to have somebody look at that query, see if there are some quick-wins like indexes that could help, or partitions or other things like that. Including the option to materialize the result of that query so that when you open your workbook it just select 12 rows without first running a heavy query.
1 -
"Streaming time" is external to Oracle Analytics. It generally indicates an issue with network, proxy, browser, client machine, etc. that you need to look into.
You can hover your mouse over the 'Streaming Time' row under the 'Request Statistics' column for a definition.
You may want to start with an HTTP Archive (HAR) capture. Please do NOT post the HAR file here in the public forum (it would need sanitization, as it contains private network, etc. information).
It may give you a clue as to what is taking time to load in the browser.
You also need to review your OAC architecture, none of us will know if you have external load balancers, edge servers, etc. configured.1
Answers
-
We run the query on the view and as per the above suggestions and it does take long time there as well, so we implemented materialized view, now both query time and streaming time have improved. Thank you for your replies @SteveF-Oracle , @Gianni Ceresa, @Federico Venturin 😀
1 -
@User_SFA90 Thanks for looping back and confirming.
Can you please update your profile next? As an Oracle employee you have to identify yourself as such in the forum. Thank you.
1