Categories
- All Categories
- 15 Oracle Analytics Sharing Center
- 15 Oracle Analytics Lounge
- 214 Oracle Analytics News
- 42 Oracle Analytics Videos
- 15.7K Oracle Analytics Forums
- 6.1K Oracle Analytics Idea Labs
- Oracle Analytics User Groups
- 78 Oracle Analytics Trainings
- 14 Oracle Analytics Data Visualizations Challenge
- Find Partners
- For Partners
Ability to reformat time in visualizations in grammar panel

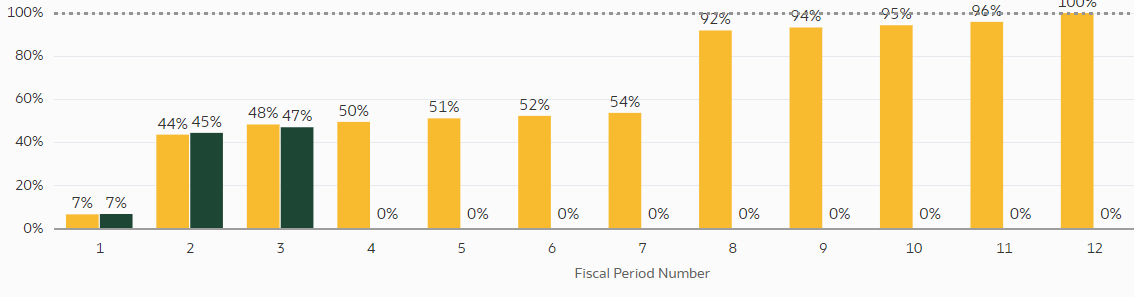
Sometimes, It would be nice to change what is shown on the x axis specifically for time based visualizations. For example, in the above visualization it would be great to change the 1, 2, 3 to June, July, August for example.
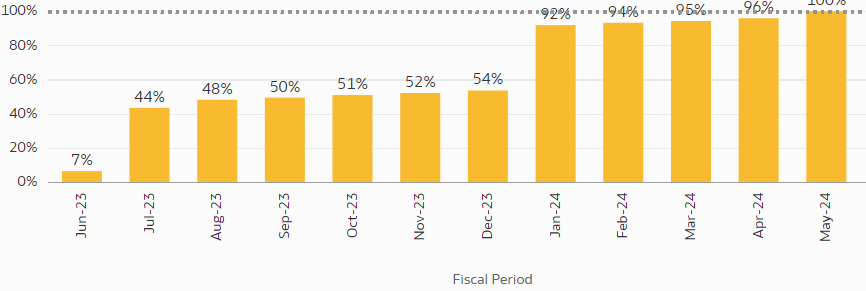
For this visual, maybe we could change the format to show a date or fully spell out the month for example.
This would give report creators the ability to create more readable and understandable reports without needing to create complex custom calculations.
Comments
-
Caroline, In FDI we have the following options:-
1.) Period Number - This shows the numerical value of the Period
2.) Period Name - This shows the Month name and appended with the Year Name.
Are you looking to see only Month Name ?
0 -
@Krishna Prasad Kotti-Oracle Just month name! In the top visual there's data from the current year and the previous year so I just want to compare things on a month basis. Basically, I'd like to keep the attributes the same (eg fiscal period number) and have the option to simply reformat the axis to show month name instead of number.
0 -
Below is an alternative solution that you can review.
1.) Create a Dataset with Period Number and Period Name columns using excel or table based datasets.
2.) Join with the Period number in out of the box with the column your custom dataset and use the period name from your Custom dataset in your data visualization
0 -
Can you try the following:-
1.) Create a DataSet (Excel/table based) which has Month Number and Month Name you need
1 June
2 July
.
.
.
.
2.) Join it with this data set and add the Month Name to the Report
0