Oracle Analytics Cloud and Server

Welcome to the Oracle Analytics Community: Please complete your User Profile and upload your Profile Picture

Creating Last 7 days/24 hours only visualizations in the workbook

Accepted answer
94
Views
6
Comments

Hello,I'm a beginner in OAC …Can anyone pls help me in my query :

As shown in attached excel sheet ,

I have a table containing Product details of my 4 products(Prod1 ,Prod2,Prod3 and Prod4) .How in my workbook i can create charts of :

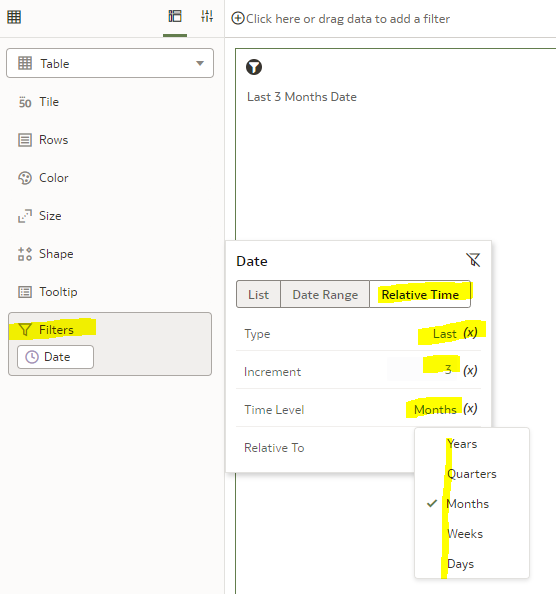
  1. Prod1 sales- Daywise (last 7 days only) .
  2. Prod1 sales- Hourly(last 24 hours only).
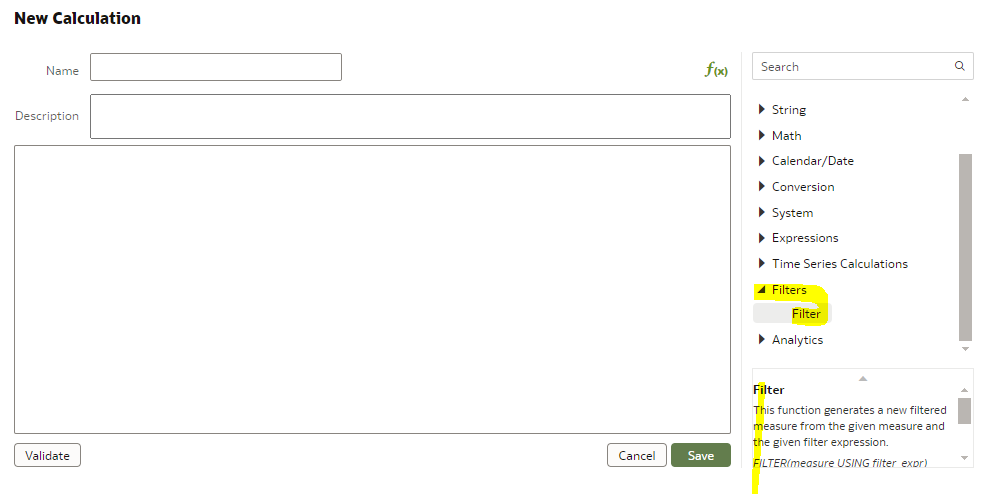
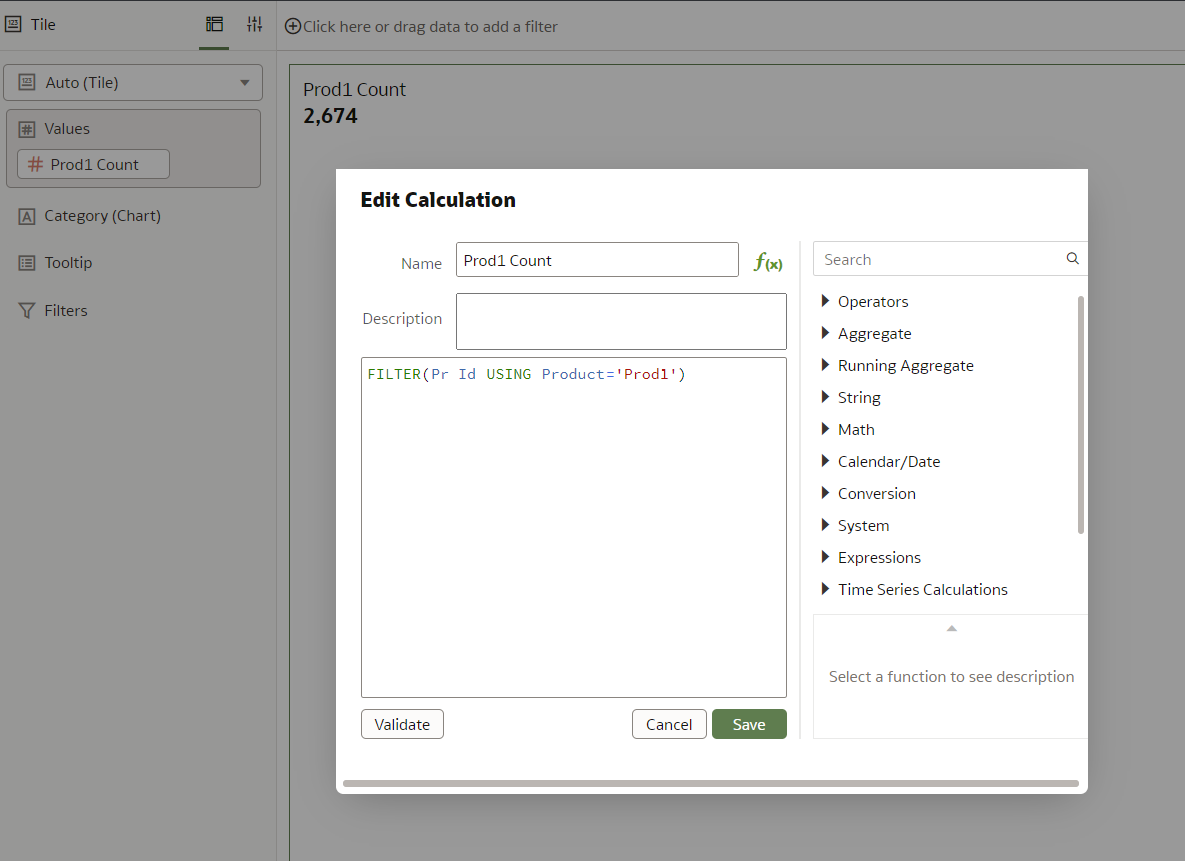
  3. Calculation for finding total count of Prod1.

Thank you,

Best Answer

  • Mostafa Morsy-Oracle
    Mostafa Morsy-Oracle Rank 6 - Analytics Lead

    @User_Y6C7L

     For Hourly(last 24 hours only) chart . I have set - Last 24 hours - Relative to : Today , but It's displaying records as per other time zone (Possibly UTC) . My Time zone is GST (Gulf Standard Time).

    »I can reproduce the day issue with your excel file I think his is a Bug and need SR to be filed because after time Zone changes issue still reproducible

Answers

  • Hi,

    In your workbook, in the visualization where you need it, you can add a filter on your date (order date or any other date in your dataset).

    You can set the filter to be "relative time" and then you select the kind of filter. As you can see from the screenshot you can easily make a "last 1 day" and "last 7 days" filter.

    image.png

    For your 3. point, depending what you need to do with it, it can be a filter on the product in the visualization, or you can create a calculation using the FILTER function. The calculation popup has the list of functions on the right, and when you select FILTER you see the description of what it does and how it does work.

    image.png
  • Hasan Sd
    Hasan Sd Rank 5 - Community Champion

    Thanks @Gianni Ceresa for the reply . After following your suggestions ,I have following doubts :

    a) For Hourly(last 24 hours only) chart . I have set - Last 24 hours - Relative to : Today , but It's displaying records as per other time zone (Possibly UTC) . My Time zone is GST (Gulf Standard Time).

    b)For Calculation for finding total count of Prod1 : The calculation is not giving currect count . My calculation is : COUNT(Filter ( Pr Id Using Product='Prod1')) .

  • You should apply FILTER to COUNT, and not COUNT to FILTER : the first parameter in the FILTER function should be a measure: it's either already a measure in your dataset, or it can be your COUNT(Pr Id).

    Time zones are always a touchy aspect because "everybody" should be speaking the same language (same location) when time zones are involved. You could just look at the generated query and figure out what the system is trying to do, and based on that you will be able to find workaround and solutions to fix things.

  • Hasan Sd
    Hasan Sd Rank 5 - Community Champion

    Dear @Gianni Ceresa thanks for quick response .

    a)The calculation output is still incorrect (screenshot below ),Pls advice :

    image.png

    b)How to see the generated query . Pls share any resources if available . We need to display the Latest 24 hrs records on our Canvas .Thank you.

  • a)The calculation output is still incorrect (screenshot below )

    Why? What is your current calculation doing and what are you expecting instead? The product simply execute queries, therefore you can see what it is doing and then correct the behavior based on your expected result.

    The easiest way to see queries in a workbook is to enable the developer options in your profile. And then in your profile from the menu you select "Developer". And there you can see the query behind every visualization in your workbook.

    image.png image.png