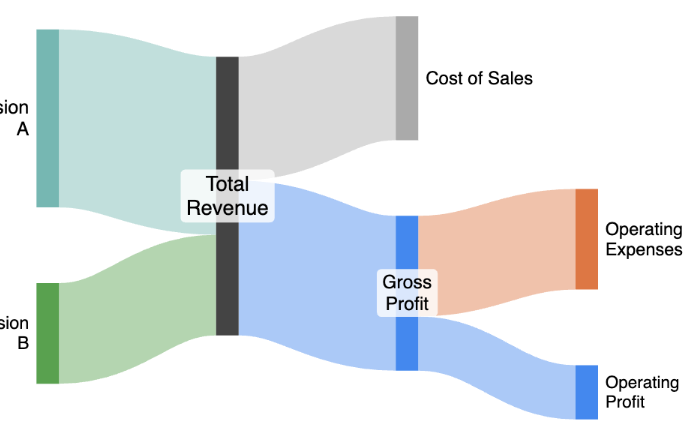
In OAC Sankey Chart, Cost of Sales will align in the far right same as Operating Expense and Operating Profit.
How to Sankey Chart property so Cost of Sales align with Gross Profit.
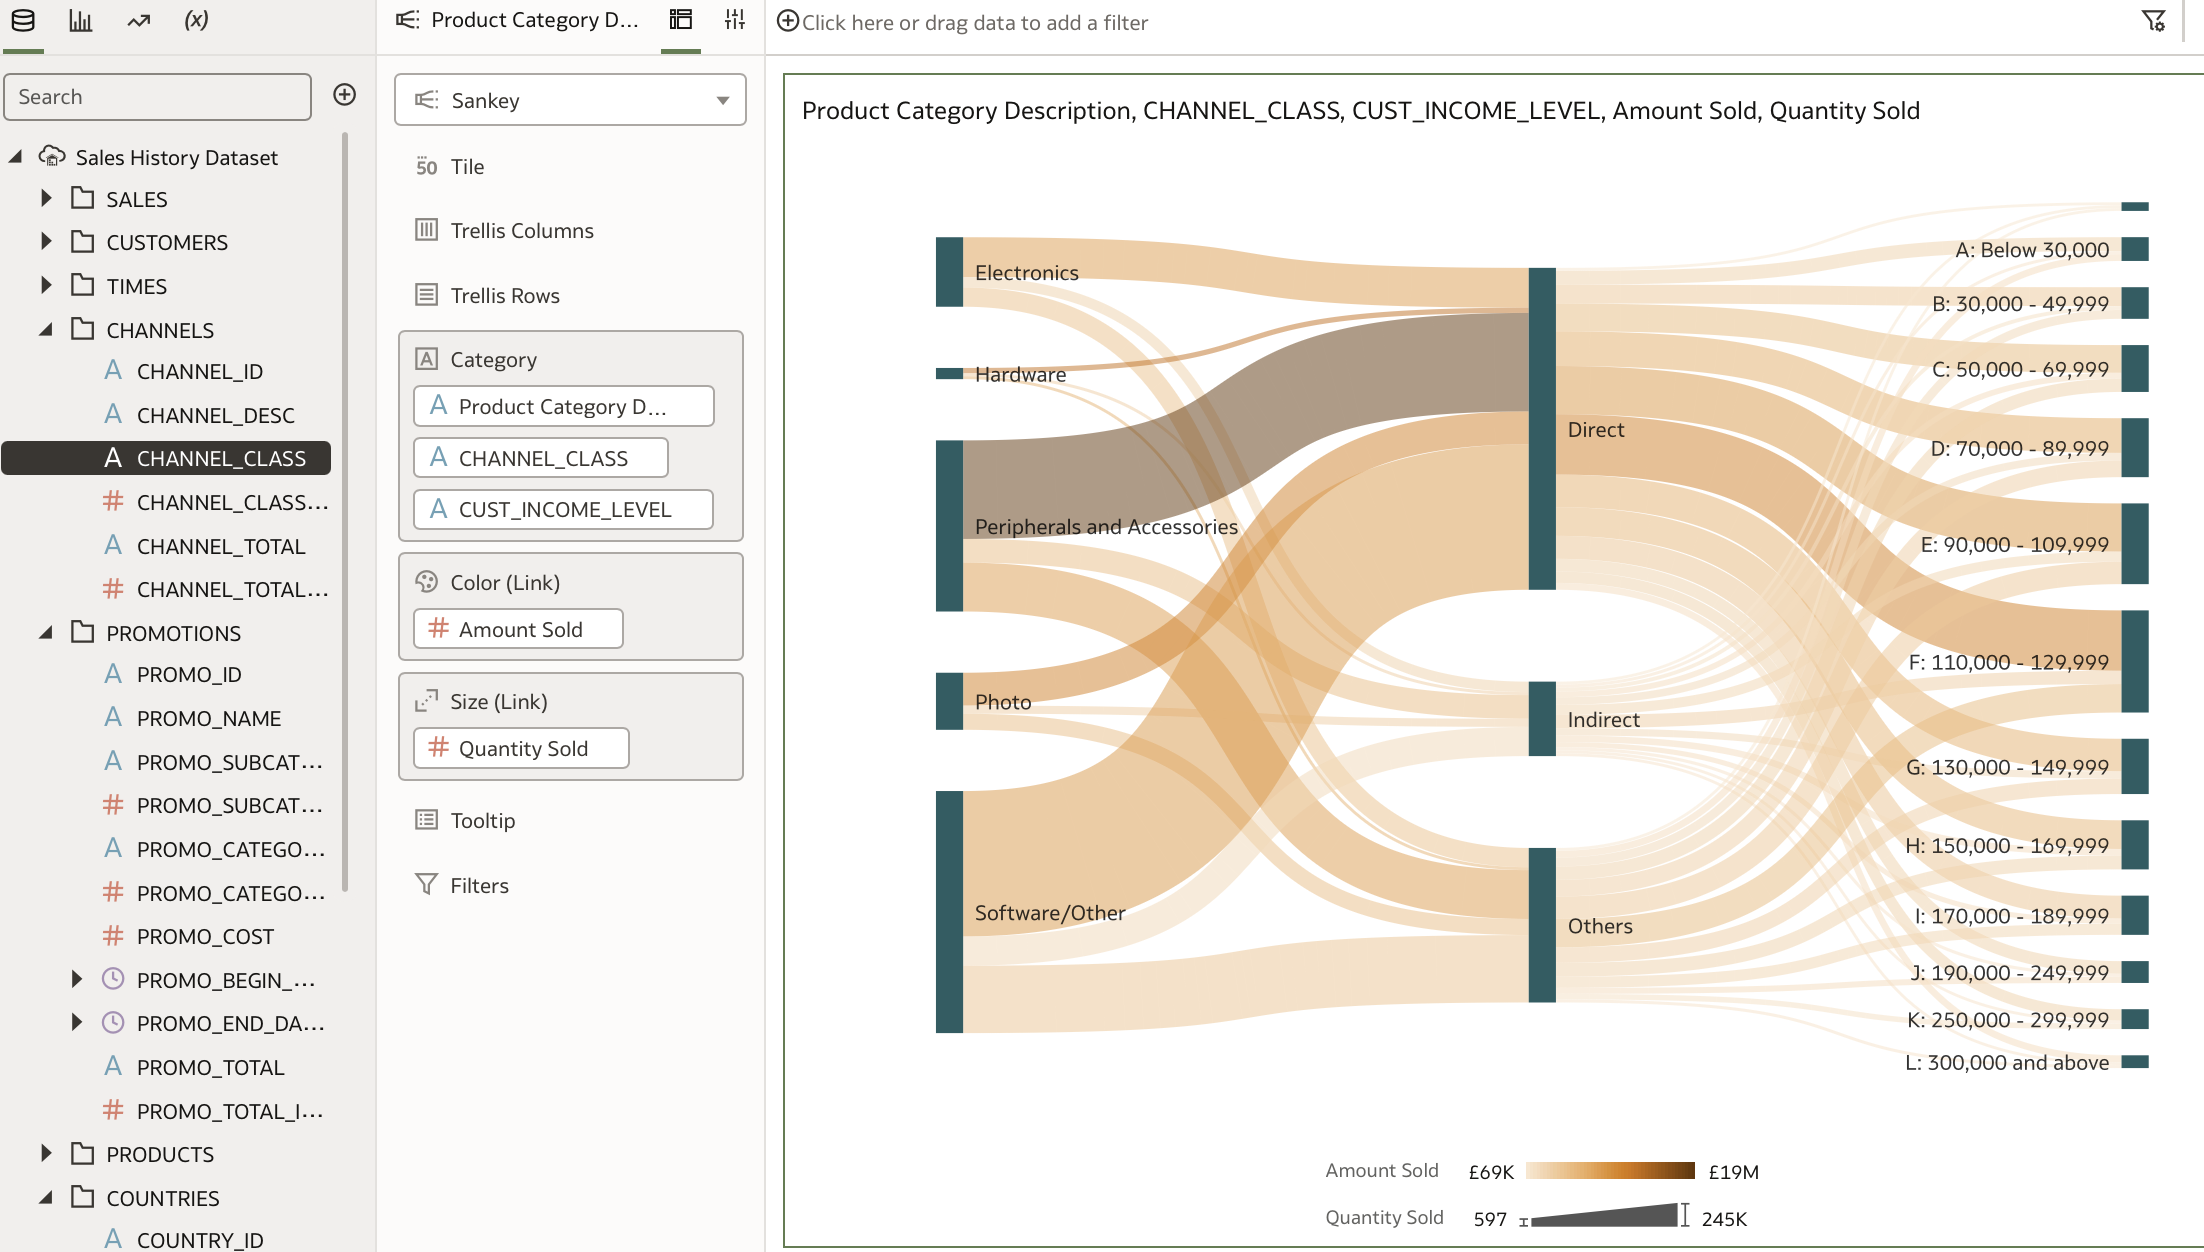
is this a screenshot from OAC? I don't believe it is as OAC automatically aligns the left and right of the sankey chart. I have attached a screenshot of a sankey chart with 3 categories similar to your screenshot and as you can see it lines up the left and right sides automatically.
If you notice COGS doesn't align with Gross Profit.
This is because the data behind the sankey chart in the YouTube video seems to have a hierarchical structure where certain financial metrics roll up into higher-level metrics.
We have similar financial hierarchical structure as the original image (similar to youtube link). I aware that data hierarchy is different. The 1st image clearly shows that hierarchy is different.
We want Cost of Sales to align with Gross of Profit but couldn't find OAC sankey property for that.
Sankey has a Group By property that you can set to Value for hierarchical data.
Does Oracle Analytics Server 2026 include AI features such as a built-in chatbot or AI Assistant? If not, are there any plans or indications that these AI capabilities will be introduced in a future OAS release?
Here is my calculation CAST(COUNT(SAAR_ID) AS VARCHAR(50)) || ' SAARs pending as of: ' || CAST(CURRENT_TIMESTAMP(5) AS VARCHAR(50))
In OAC when I am creating a dataset, How can I pass a Filter from the "Dashboard filters to the SQL? I attached a image like it was don in BIP Publisher
How can you put a total number of records in your oracle OAC table footer
we have two seperate environments in air gap… 1- oas 2024 2- oas 2026 developers in both env, required extensions like push button, racing bar, guage…. where to download.