Categories
- All Categories
- 15 Oracle Analytics Sharing Center
- 19 Oracle Analytics Lounge
- 222 Oracle Analytics News
- 44 Oracle Analytics Videos
- 15.8K Oracle Analytics Forums
- 6.1K Oracle Analytics Idea Labs
- Oracle Analytics User Groups
- 83 Oracle Analytics Trainings
- 15 Oracle Analytics Data Visualizations Challenge
- Find Partners
- For Partners
Line-chart show no value if one of the measure type is zero value for specific month

Hello Group, I have to build a report that display 2 measures according to Month of Year.
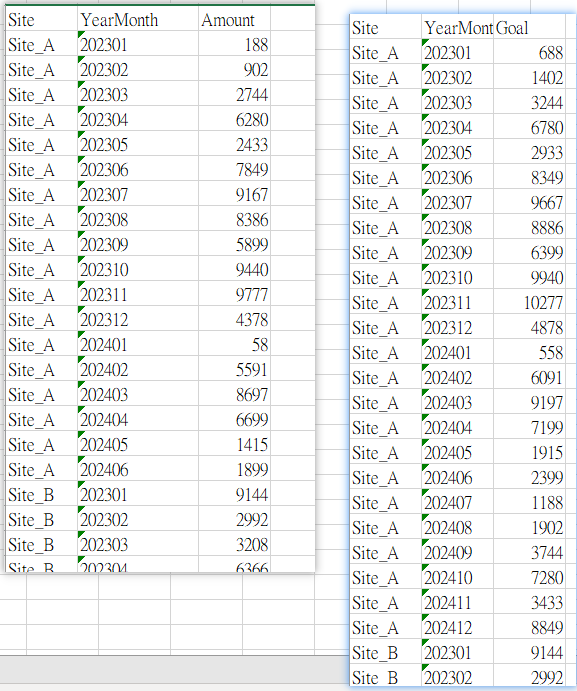
The Data set is like:
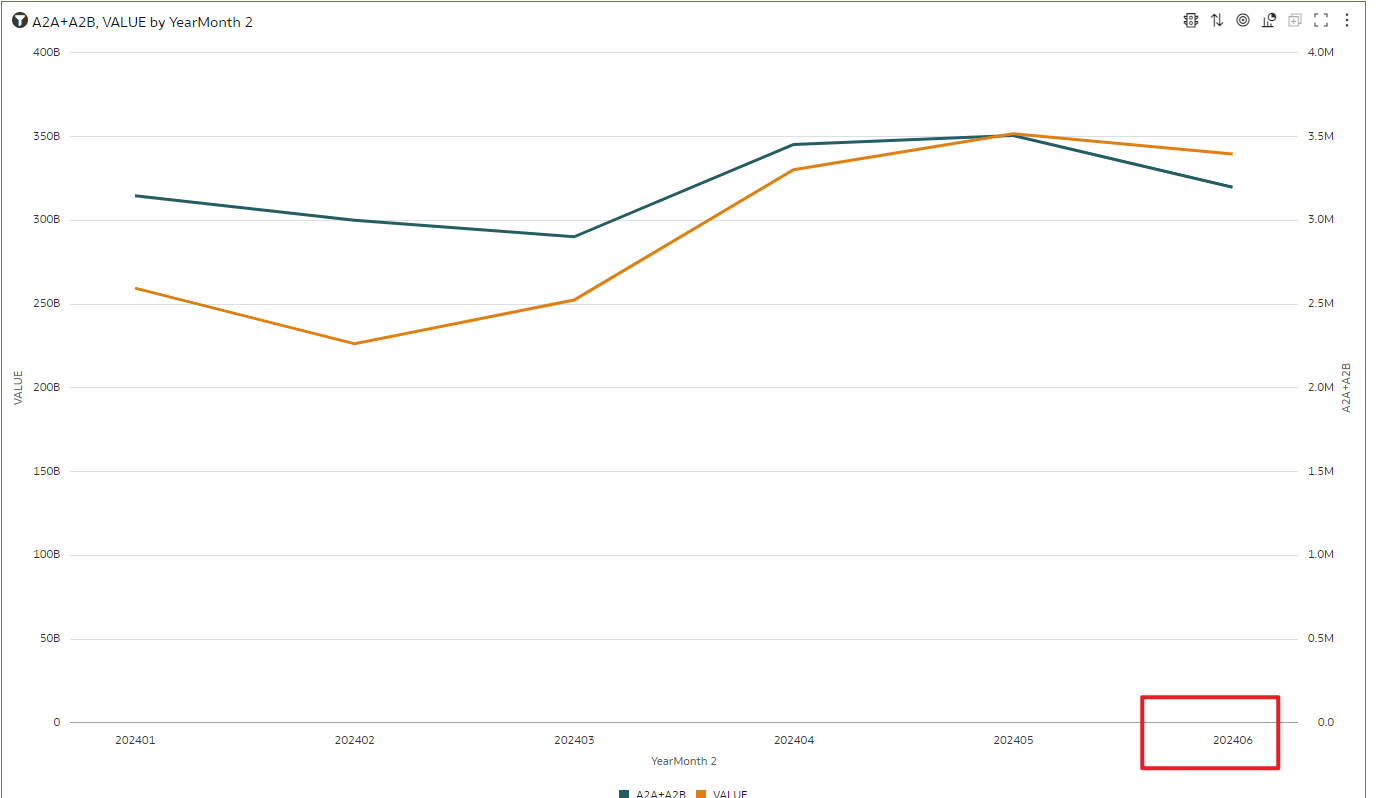
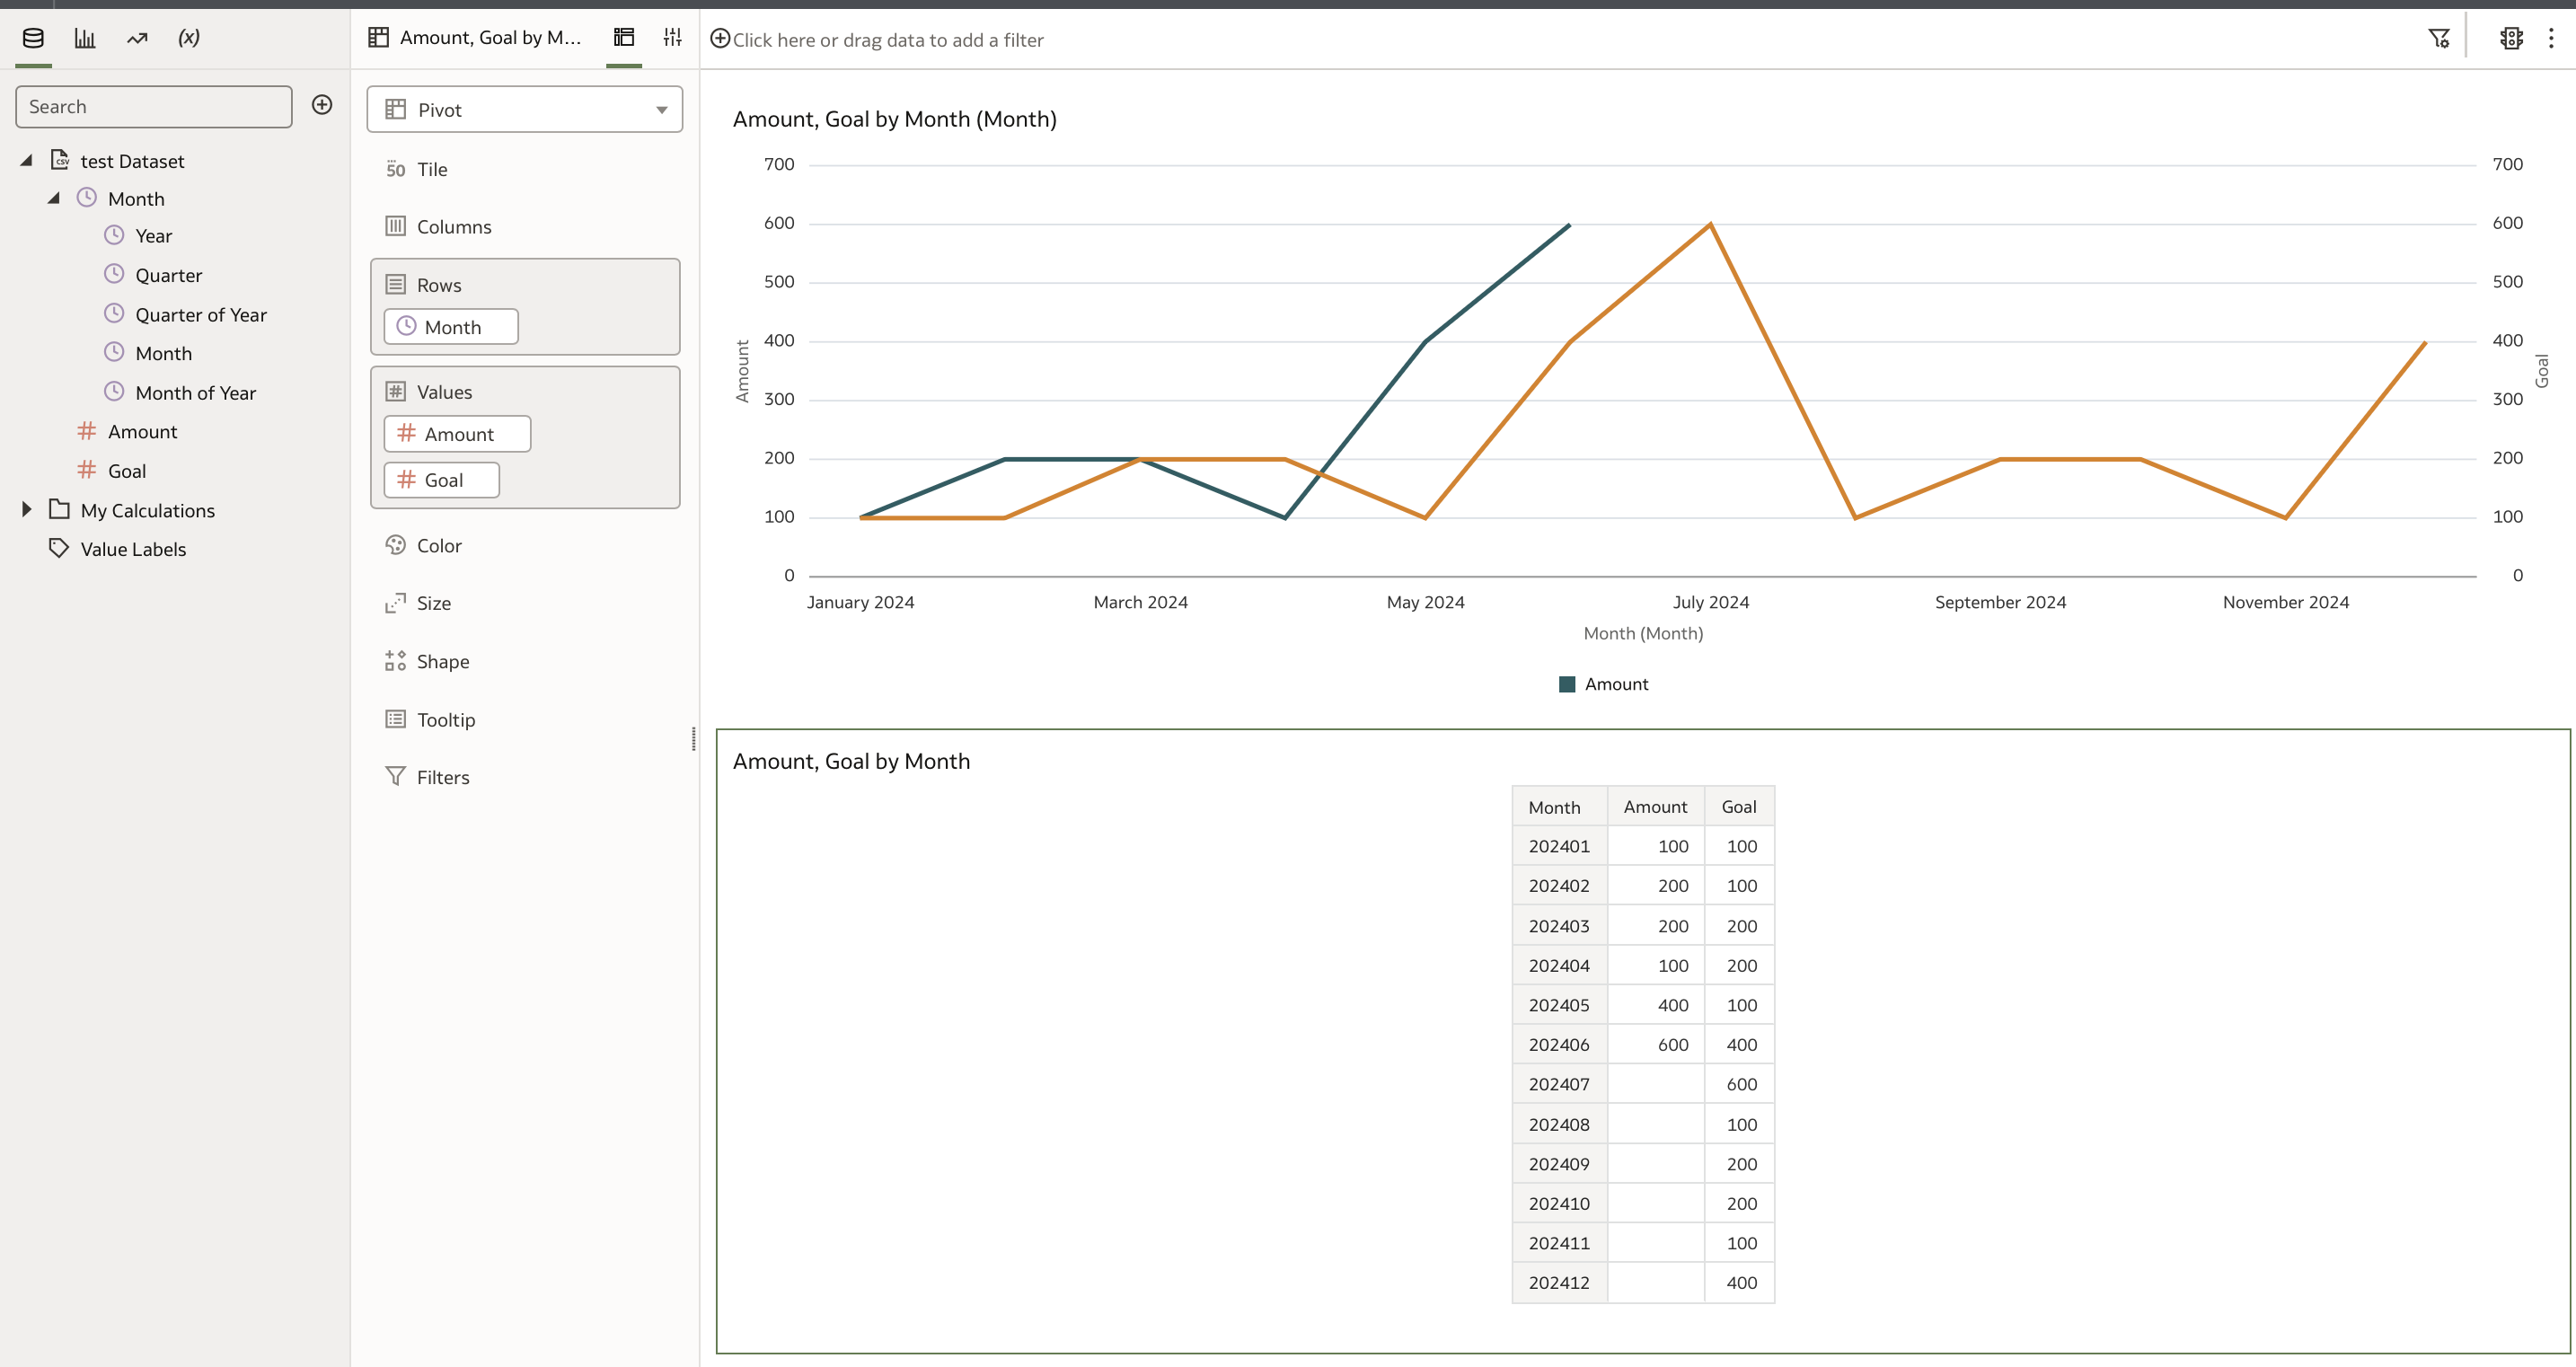
When I go to display using a line graph the line chat shows like zero value after 202407, like the graph below:
please help if you have any suggestions or any prerequisite should I do?
Thanks!
Answers
-
@Kirk Li - It appears that the Amount column has null values starting from July 2024. Please update these null values to 0, which should display all values correctly in the graph. Thank you!
1 -
Your screenshot of data and visualisation screenshot seem to be of 2 different sets of data. The visualisation should just return the data with the nulls as you can see below. Can you provide more information on what you're trying to do?
1 -
Thank you,Sumanth!
Thank you,Joel!
My purpose is to compare the Monthly Amount (Cost) to the Goal setting for each month for each site(Location).
We have 2 scenario for analysis:
1.Compare Site_A,Site_B Amount with Site_A's and Site_B's Goal by YearMonth,
2.Compare the sum of Site_A's Amount and Site_B's Amount with the Goal which Site value is Site_AB
We also wonder which way to join this 2 table for purpose.1 and Purpose.2
For Example, Inner Join Cost and Goal With Key-Site,Key-YearMonth
Should we create 2 data set seperately for this scenario.
Thanks a lot!
0