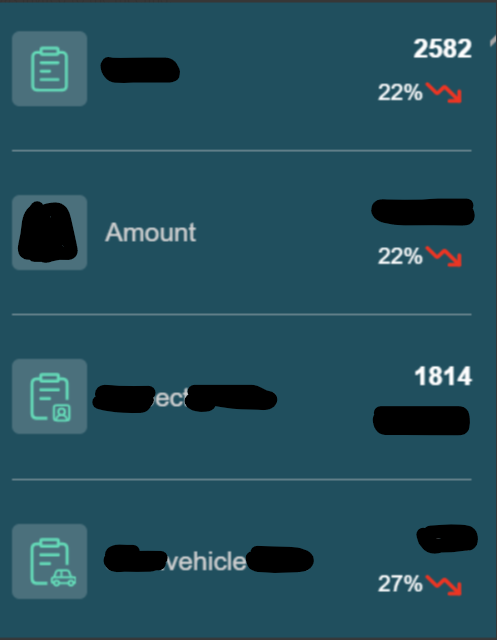
Hii OAC Community….We have a requirement to create a visualization as shown below .We tried using Tile Visualization but how to add Horizontal Lines ? Pls suggest how to create this visualization .Thank you
Hi @Hasan Sd , you can build it easily with the image viz type for the icon, then the Tile with conditional formatting for the down arrow in red. Finally, you can add borders to the tile, but the borders will be on all sides (for now, there is an idea in the idea lab to select which border side you want).
If you want ONLY the border to be at the bottom side of the tile, then I would recommend to put an horizontal bar image with a transparent background. You can easily find it in Google Image Search.
Does Oracle Analytics Server 2026 include AI features such as a built-in chatbot or AI Assistant? If not, are there any plans or indications that these AI capabilities will be introduced in a future OAS release?
Here is my calculation CAST(COUNT(SAAR_ID) AS VARCHAR(50)) || ' SAARs pending as of: ' || CAST(CURRENT_TIMESTAMP(5) AS VARCHAR(50))
In OAC when I am creating a dataset, How can I pass a Filter from the "Dashboard filters to the SQL? I attached a image like it was don in BIP Publisher
How can you put a total number of records in your oracle OAC table footer
we have two seperate environments in air gap… 1- oas 2024 2- oas 2026 developers in both env, required extensions like push button, racing bar, guage…. where to download.