Oracle Analytics Cloud and Server

Welcome to the Oracle Analytics Community: Please complete your User Profile and upload your Profile Picture

Canvas Export Issue - Multiple Overlaid Visualizations Not exporting Properly

Accepted answer
72
Views
6
Comments
Sherry J George
Sherry J George Rank 4 - Community Specialist

Version: Oracle Analytics Server (OAS) 2025

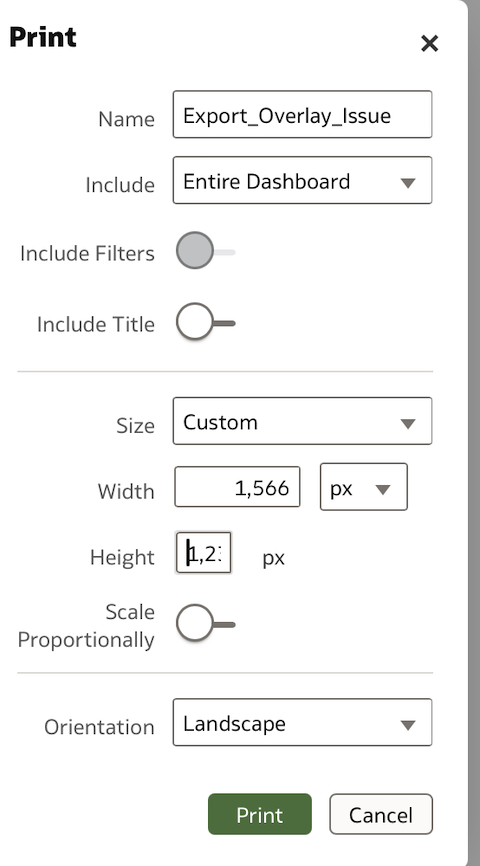
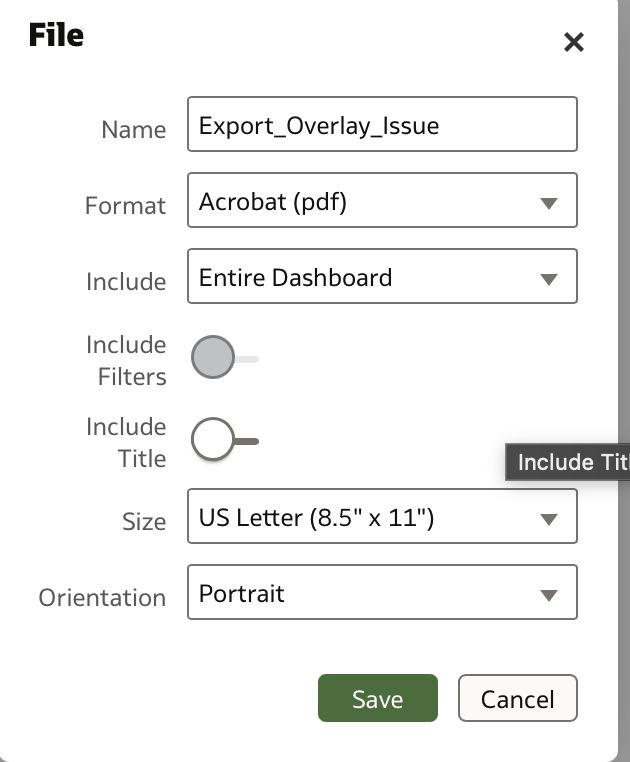
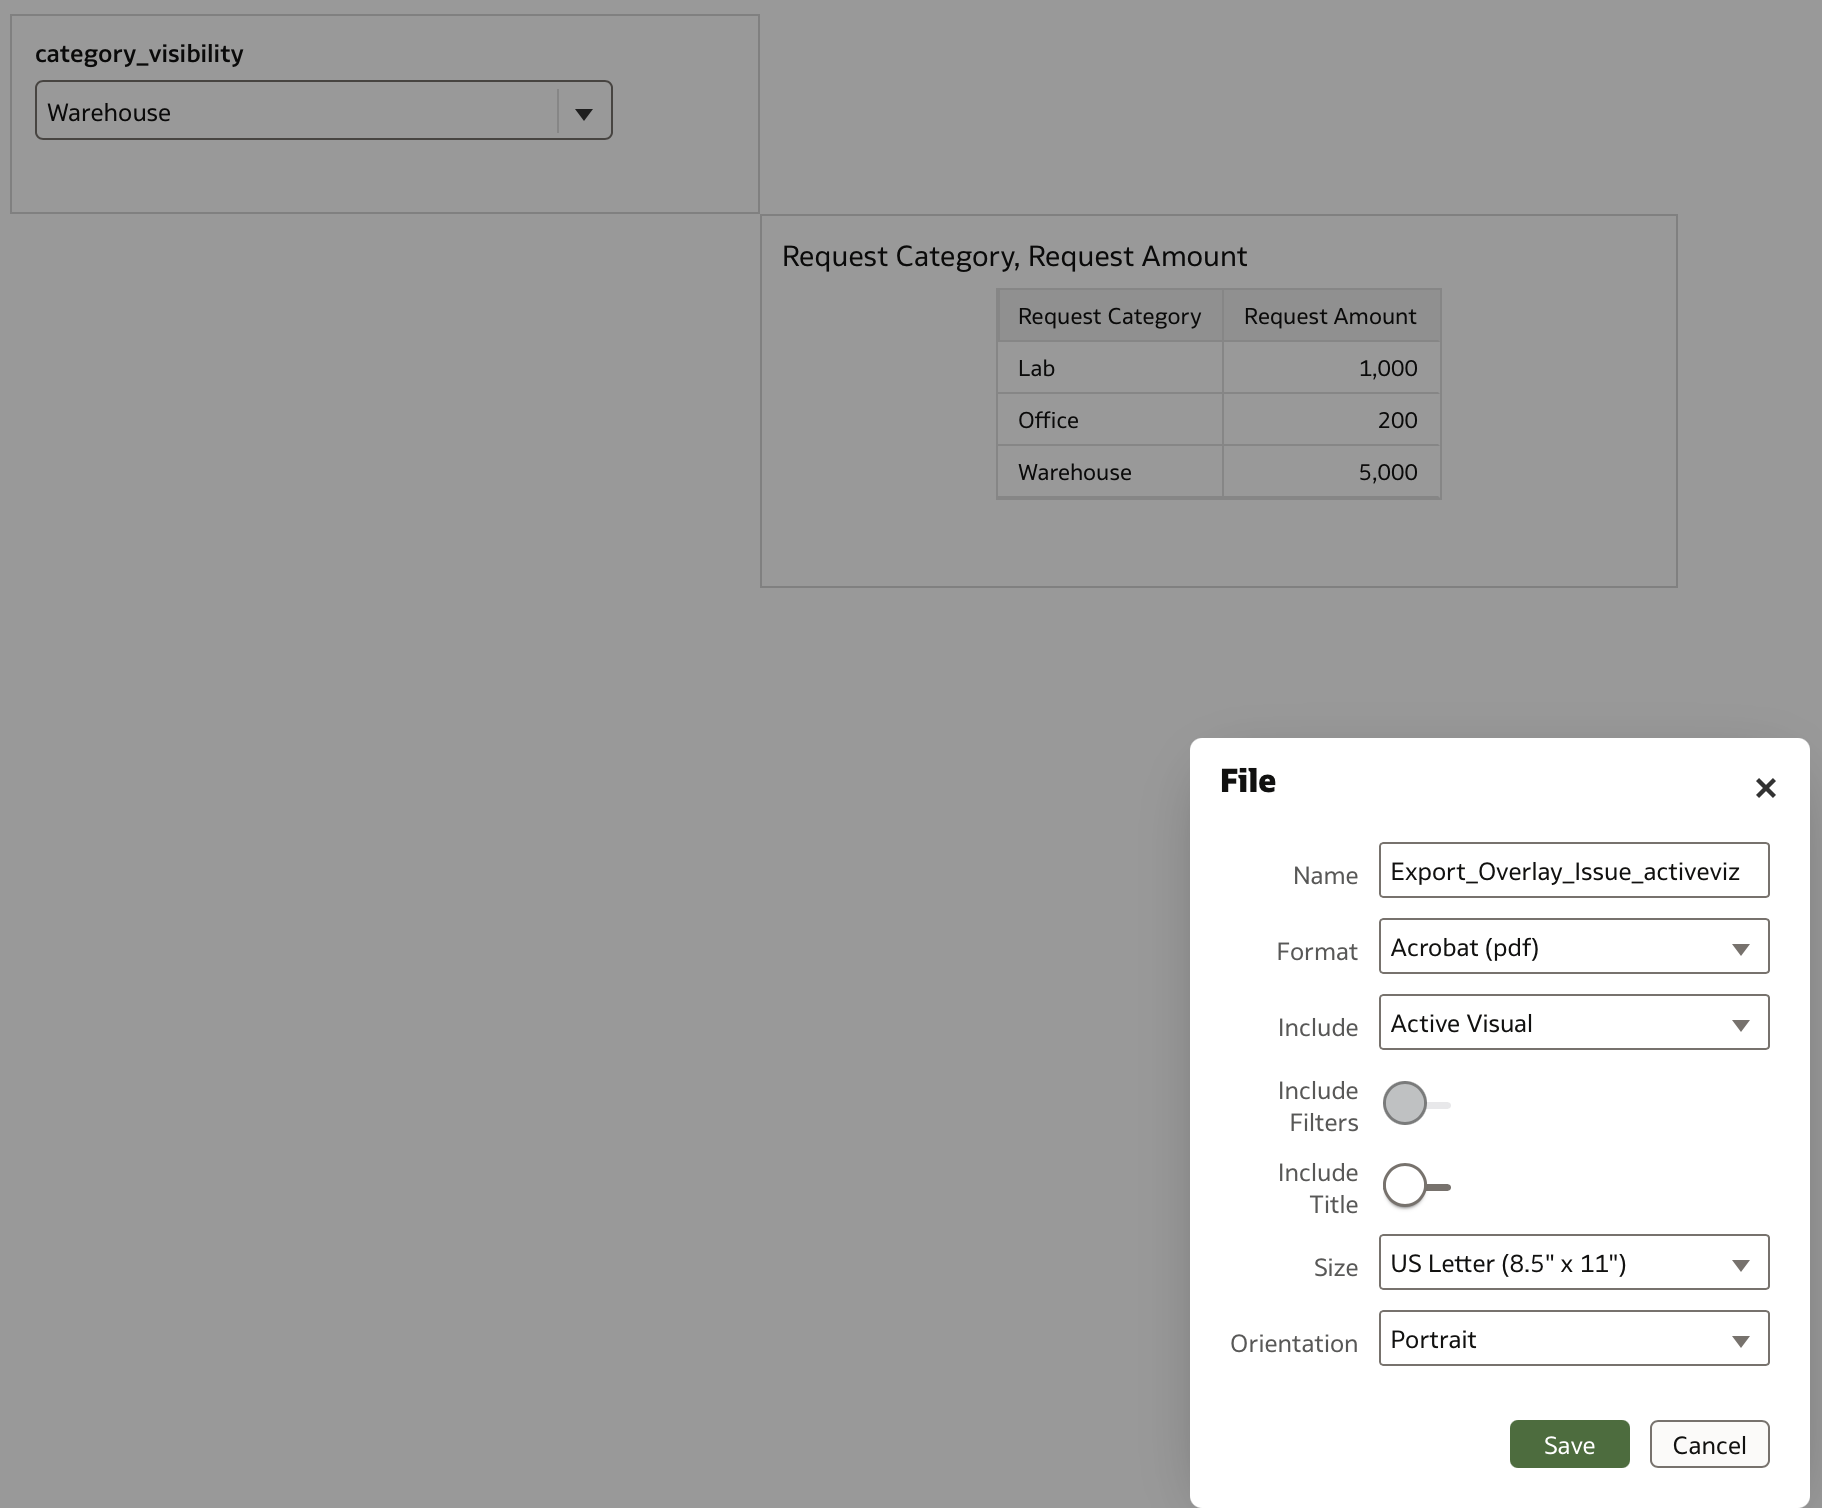
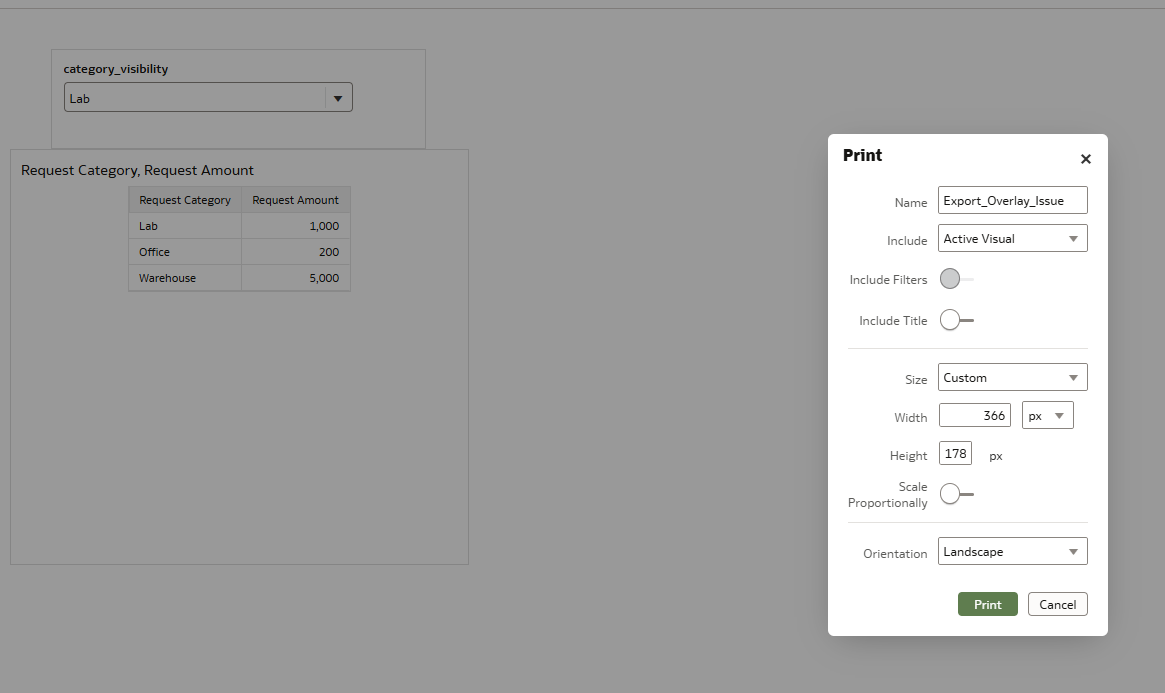
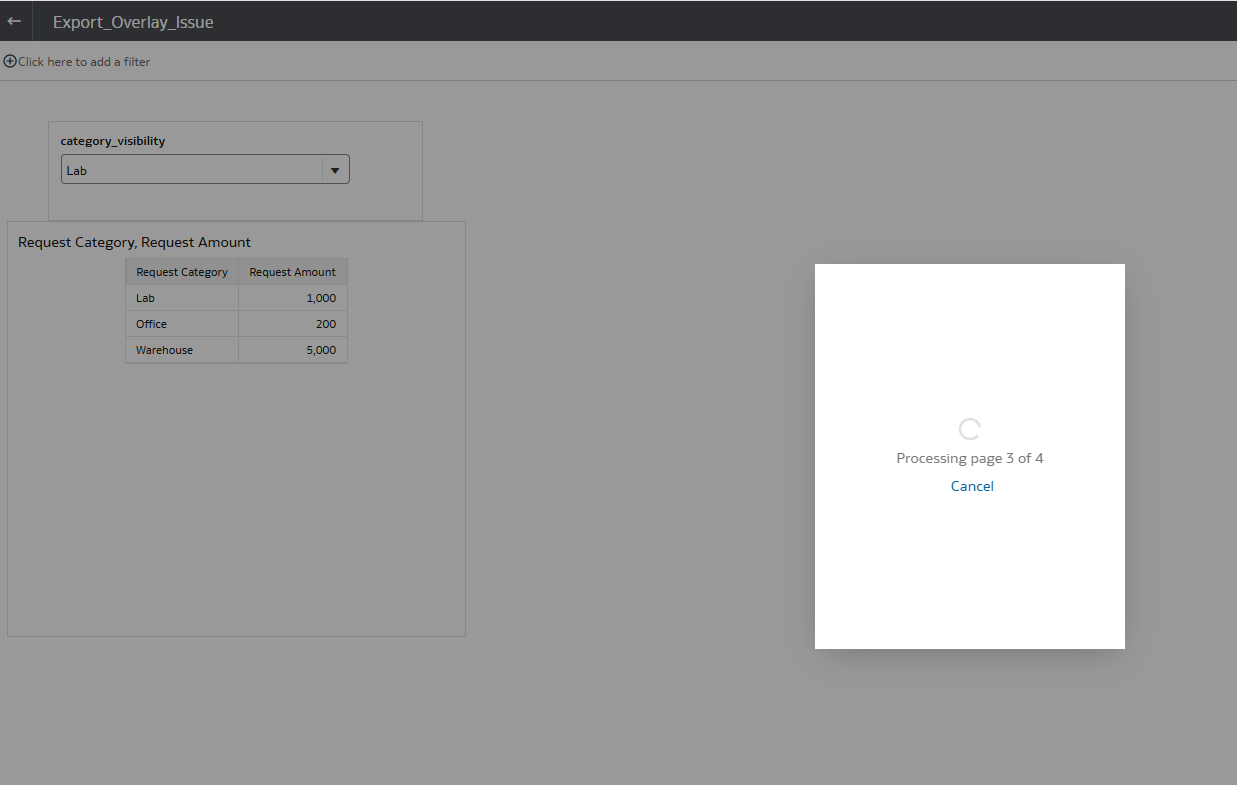
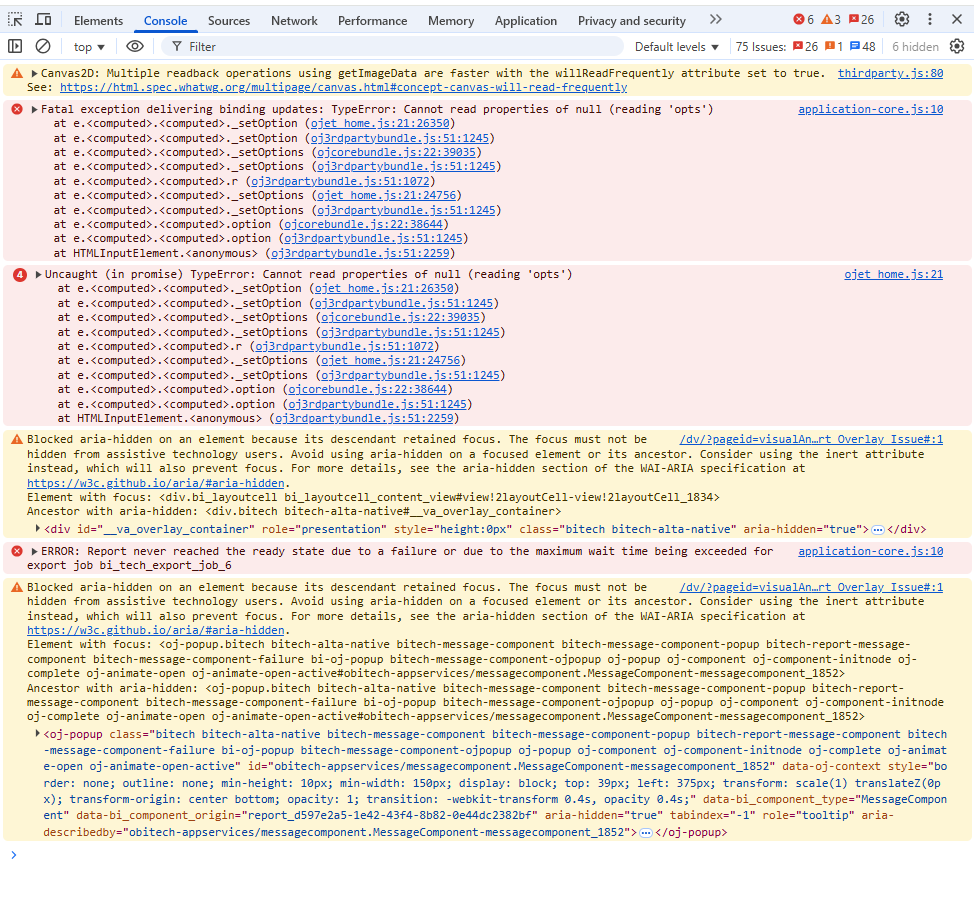
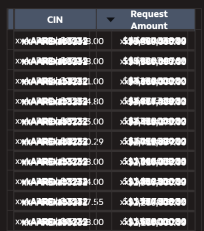
I have built a canvas with multiple table visualizations overlaid on one another. The display is controlled using the Visibility parameter, which works perfectly in Preview mode. However, when I attempt to export the canvas, the visualization becomes unreadable. It appears that all underlying visuals are being exported simultaneously, rather than just the visible one. Is there a setting that can correct this export behavior? Are there any recommended workarounds or best practices for this scenario?

OAS canvas export.png

Thanks,

Sherry

Best Answer

  • SteveF-Oracle
    edited Jul 31, 2025 5:00PM Answer ✓

    Hi Sherry,

    Thanks for the DVA.
    I did a test with OAS 2025 + July 2025 patch applied.
    From preview mode, I Printed to PDF and Exported File to PDF
    I was using Safari Browser on MacOS to Print to PDF

    the visualization becomes unreadable

    I did not reproduce this, everything was readable.
    Here are the screenshots of Print. Custom size and orientation was automatically selected. There is a UI bug the height is 1,234 pixels. It also printed clearly with US Letter - Portrait options selected.

    Screenshot 2025-07-31 at 12.01.20 PM.png


    File > PDF also exported clearly


    Screenshot 2025-07-31 at 12.13.24 PM.png

     It appears that all underlying visuals are being exported simultaneously, rather than just the visible one. Is there a setting that can correct this export behavior?

    In the sample DVA test, all three visualizations export, not only visible selection.

    The same behavior in Oracle Analytics Cloud

    As a workaround, I was able to change 'Include' to 'Active Visual' and select both the 'category_visibility' visualization and the 'table visualization' to get those to print vs. all three tables.

    In summary, your jumble output may be due to page size settings, or possibly a fix in July patch. The output for entire dashboard is correct behavior. Anything else may require an Idea Lab request enhancement with an example.

    [EDIT: I selected active visitations with command+click (probably control+click for Windows) ]

    Screenshot 2025-07-31 at 12.58.11 PM.png


    I do believe there are some enhancements in this area under evaluation, no timeline.

    Other comments, welcomed.

Answers

  • Hi Sherry,

    It may be helpful to reproduce the issue with sample data, and share the .dva + the exact steps / screenshots of the export options you are using.

    If you are unable to do that in the public community, then a service request may be necessary. Including the output of: opatch lspatches

  • Sherry J George
    Sherry J George Rank 4 - Community Specialist

    Hi Steve,

    Thank you for looking into this. I have attached a dva file. The workbook has three table visuals controlled through a dashboard filter + visibility parameter. In preview mode based on the filter value selected the appropriate visual shows up. Then I tried to export using two option in Preview mode.

    1. Click the Export icon>Print>pdf
    2. Click the Export icon>File>pdf

    After the file was saved, in both cases all visualizations were printed and not just the active one. The patch information is below. Latest patches will be applied soon and I will try to re-test after that.

    opatch lspatches

    37851551

    WLS STACK PATCH BUNDLE 12.2.1.4.250418 (Patch 37851508)

    37714186

    WLS PATCH SET UPDATE 12.2.1.4.250317

    37710654

    FMW Thirdparty Bundle Patch 12.2.1.4.250314

    37506516

    RDA release 25.2-2025415 for OFM 12.2.1.4 SPB

    37297691

    OSS 19C BUNDLE PATCH 12.2.1.4.241119

    37258699

    JDBC19.25 BUNDLE PATCH 12.2.1.4.241107

    37056593

    One-off

    36789759

    FMW PLATFORM BUNDLE PATCH 12.2.1.4.240812

    35965629

    ADR FOR WEBLOGIC SERVER 12.2.1.4.0 CPU JAN 2024

    1221425

    Coherence Cumulative Patch 12.2.1.4.25

    36946553

    FMWCONTROL BUNDLE PATCH 12.2.1.4.240814

    37284722

    WebCenter Core Bundle Patch 12.2.1.4.241114

    37836334

    ADF BUNDLE PATCH 12.2.1.4.250416

    34809489

    One-off

    36316422

    OPSS Bundle Patch 12.2.1.4.240220

    37684007

    OWSM BUNDLE PATCH 12.2.1.4.250309

    37526122

    DATABASE RELEASE UPDATE 19.26.0.0.0 FOR FMW DBCLIENT (37526122)

    36649916

    One-off

    35065206

    One-off

    31032676

    One-off


    Thanks

    Sherry

  • Sherry J George
    Sherry J George Rank 4 - Community Specialist

    Thank you, Steve, for checking on this.

    I did not overlay the visuals in the sample I attached, which is why I guess the PDF was readable when you printed it. The reason I avoided the overlay was to demonstrate that instead of printing just the active visual, all visuals were being printed. Now that I think about it I should have done the overlay, it was not the best example.

    If I understood correctly, when exporting or printing an entire dashboard/canvas, the default behavior includes all visuals—even those not currently shown on the canvas. I will check on the include options and see if that workaround produces the results I'm looking for. The servers are currently being patched, so I'll provide an update once they're back online.

    I feel like when a user is trying to export the dashboard/canvas, they are viewing, those not shown on the page should not be included.

    Thanks,
    Sherry

  • Hi Sherry,

    I get your point. Thanks for clarifying the test case.

    I toggled on the grid lines, made each viz exactly the same size, then overlaid.
    Then I exported entire dashboard.
    It's a little closer with minimal bleed through (seems to bold it)


    However, I think this workaround only works if all the visualizations are exact when results are returned.

    I feel like when a user is trying to export the dashboard/canvas, they are viewing, those not shown on the page should not be included.


    I think your use-case is valid one, but may not have been in a technical scope for the feature development.

    I recommend that you file an Idea Lab request and include your business use case and the example (you can reference this discussion URL). and then post the Idea request here.

    @Avinash Krishnaram-Oracle

  • Sherry J George
    Sherry J George Rank 4 - Community Specialist

    Hi Steve,

    Thanks again for your continued support.

    I tried the "Active Visual only" option, but it keeps spinning on page 3 of 4 for some reason. I'll need to check the logs to see what's causing this issue (we did patch the servers last night). The other export options work fine.

    Regardless, I think selecting visuals this way isn't very intuitive, but I appreciate the workaround and will mark the response as the answer.

    Here is what I did, clicked on one the table visual and did ctrl+A to select all and then export > print

    image.png image.png

    Browser Console Errors

    image.png

    Thanks,
    Sherry