Oracle Analytics Cloud and Server

Welcome to the Oracle Analytics Community: Please complete your User Profile and upload your Profile Picture

How to do this in Pivot graph in OAS BI Tool

Received Response
46
Views
3
Comments

Hi All,

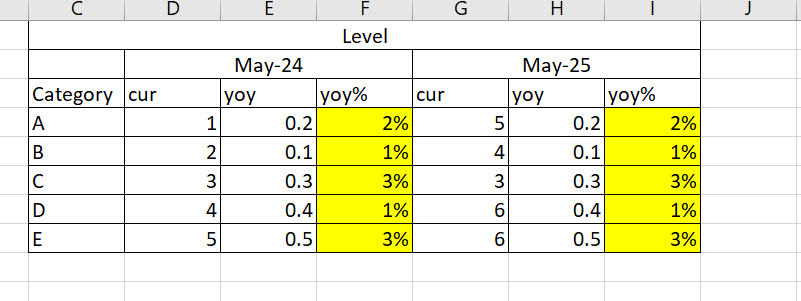
Please see the screenshot I am using pivot graph . But yoy and yoy% its repeating same in two columns, what i want yoy and yoy% to reflect after May-25 , so its like category, cur, may-24, may-25, yoy , yoy%

I am using expression filter to show latest month available data set and previous year month data. example if my dataset has may-24 to may-25 im showing this two month only.

s1.png s2.png

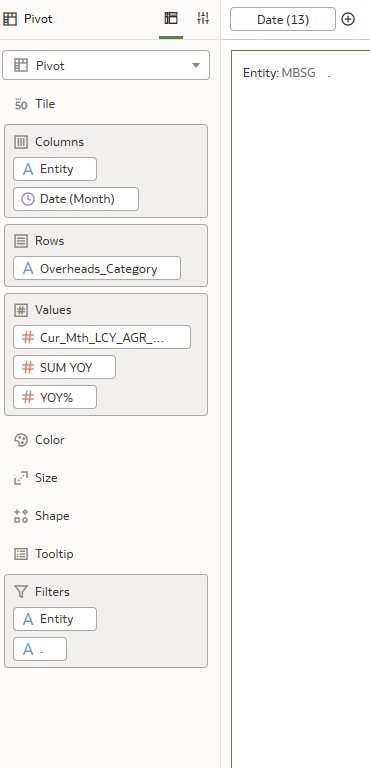
Right now, im seeing same value in both month

Tagged:

Answers

  • User_65OG0
    User_65OG0 Rank 2 - Community Beginner

    Hi All , any solution for this?

  • how are you getting the YoY? Semantic Model or DV Calculation?

  • User_65OG0
    User_65OG0 Rank 2 - Community Beginner
    edited Aug 19, 2025 1:10AM

    @Wayne Van Sluys its a calculated field . Below is the logic

    AGGREGATE(
    SUM(
    CASE
    WHEN YYYYMM
    = AGGREGATE(MAX(YYYYMM)
    BY ENTITY
    THEN CUR
    ELSE 0
    END
    )
    BY Category
    ) -

    AGGREGATE(
    SUM(
    CASE
    WHEN YYYYMM
    = AGGREGATE(MAX(YYYYMM)
    BY BY ENTITY - 100
    THEN CUR
    ELSE 0
    END
    )
    BY Category
    )