Currently, the only two options for result_type are ('VALUE','MODEL'). If 'MODEL' is selected, it returns a long JSON string with the slope, intercept, some input parameters, and some regression metrics. This JSON string is not particularly usable in an OAC dashboard.
I would like to request the addition of more result_type options which return the details from the JSON 'MODEL' as numeric values:
- SLOPE
- INTERCEPT
- STD_ERROR
- R_SQUARED
Value
If I could extract the slope of the regression (at the level of partitionBy) then this calculation would become highly valuable for me in determining whether there is trending occuring in my data. Being able to return these metrics as numeric values enables sorting, filtering, and further calculations which are not possible today.
Example
I have a data set of power values for many devices which are categorized in platforms. I want to understand at the platform level if the average power of its racks is increasing, decreasing, or staying the same.
In other words, I am looking to fit a regression in order to calculate slope. When I use the TRENDLINE() function with result_type = MODEL, I can see the slope in the JSON. But this does not help me create a visualization or other columns because it is buried in the JSON.
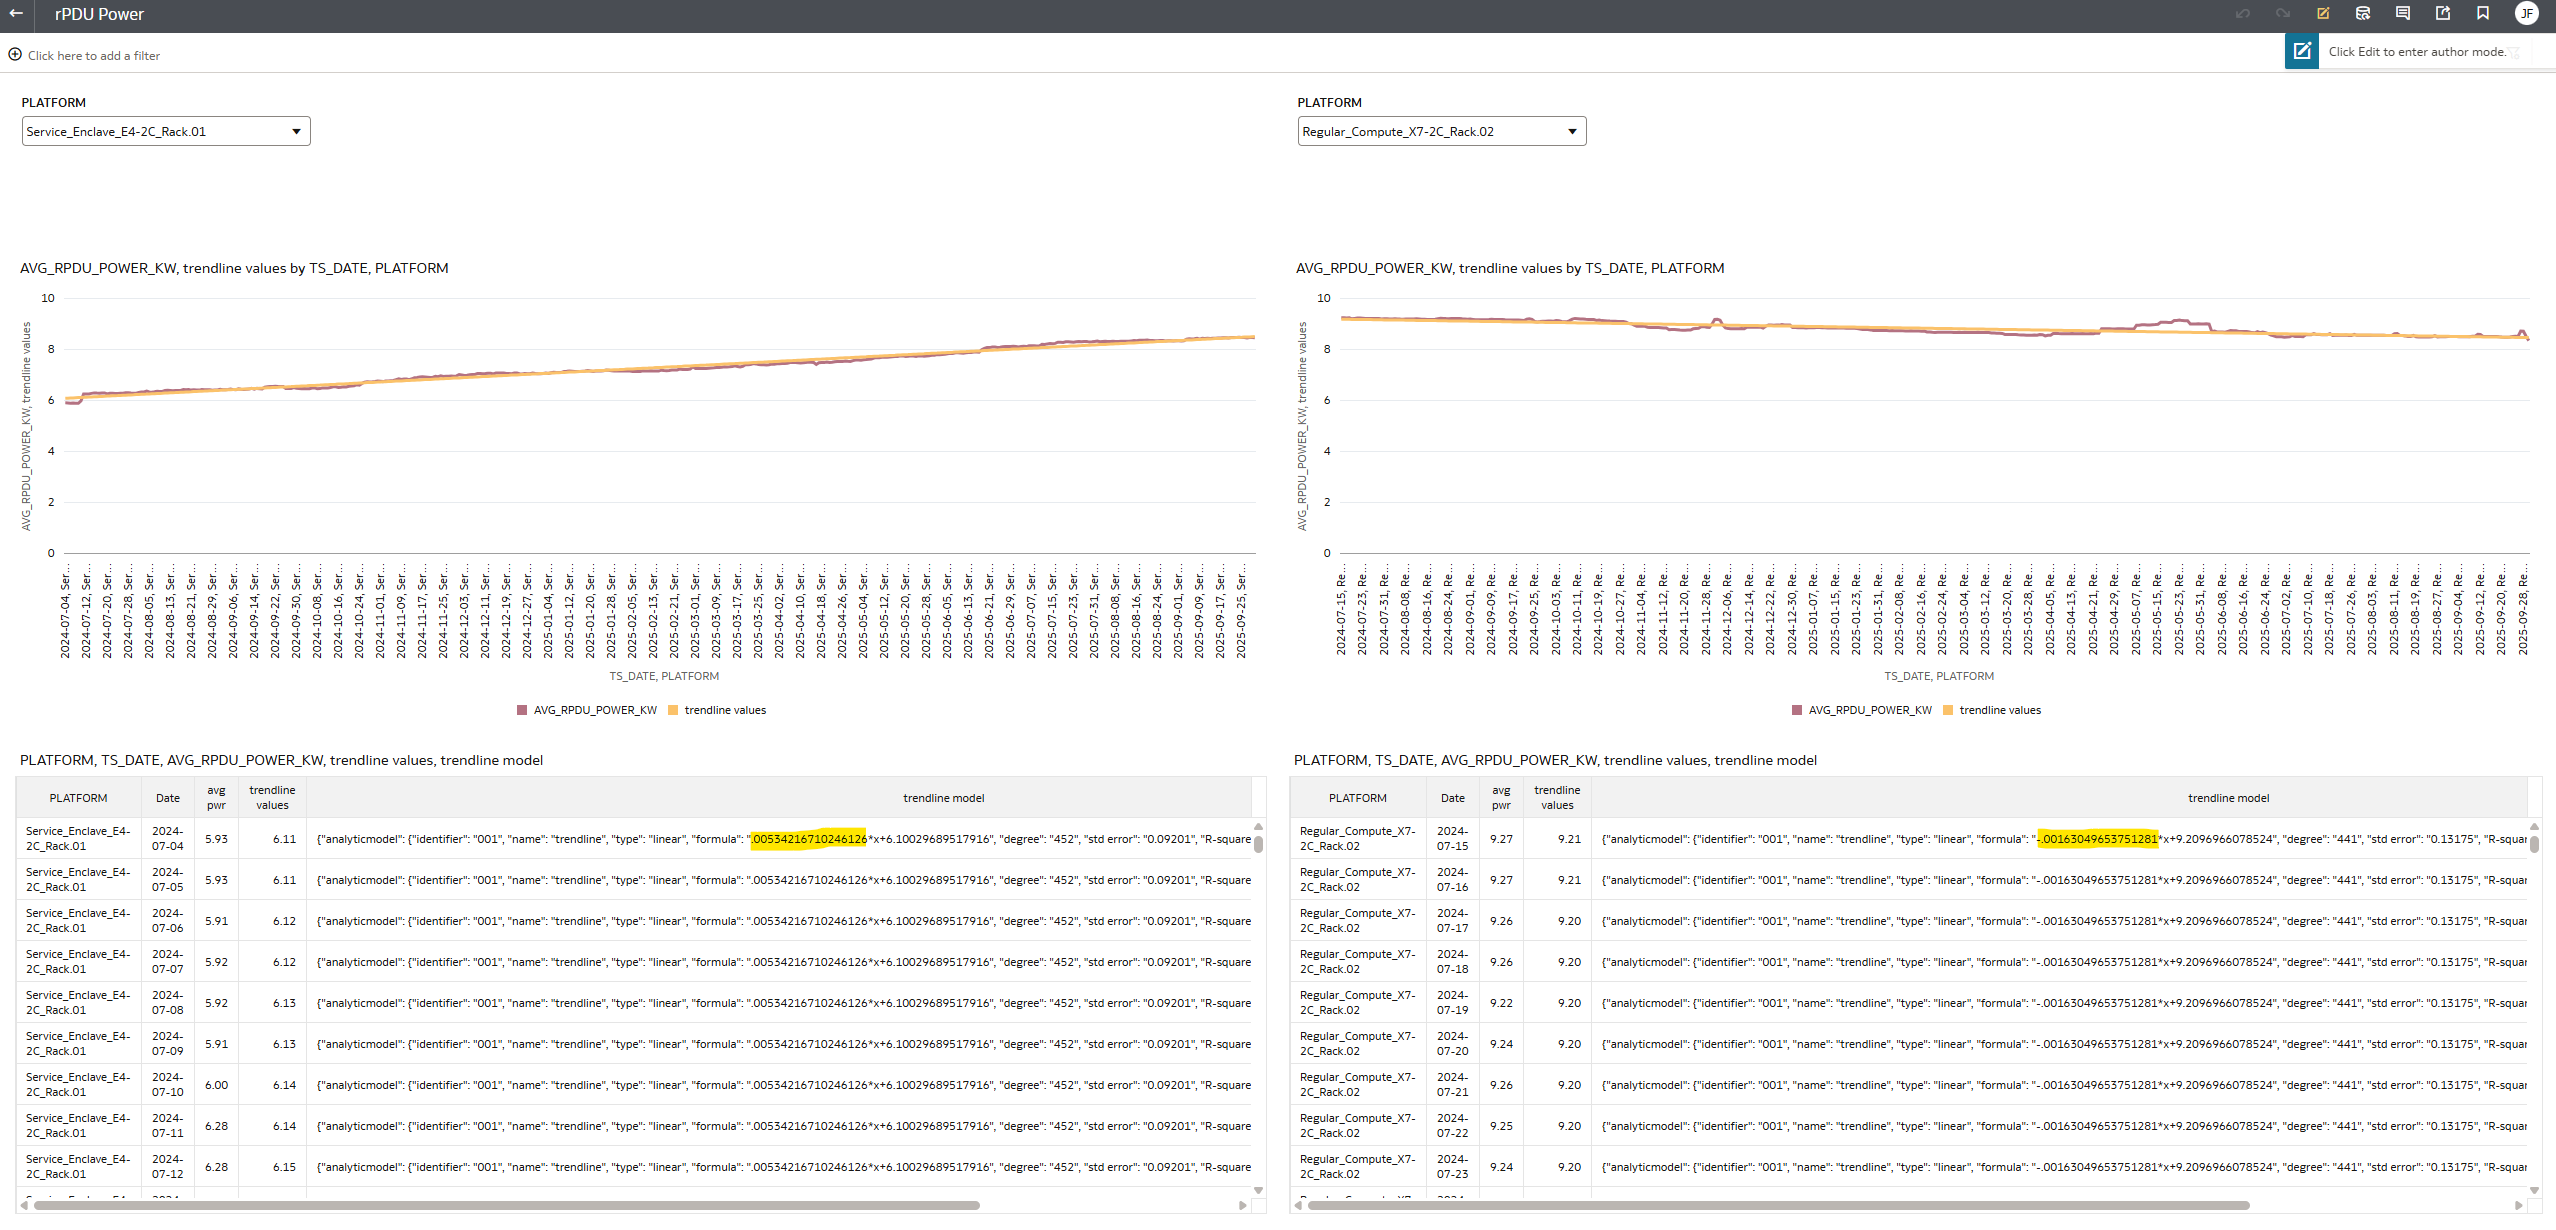
I want to be able to enter the argument 'SLOPE' and have the highlighted numbers returned from the TRENDLINE() function as a numeric column which I could then sort and filter.