Enable users to export or view in a table format the forecasts generated from graphs using ETS, ARIMA, or Prophet models.
Brillant idea!
Loved the idea. Thinking of few use cases:
Edit:
Upvoted.
Yes this is a great idea and fits in with similar related submitted ideas elsewhere
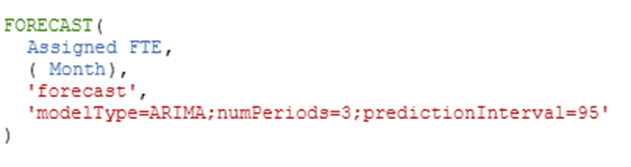
As mentioned by @Gianni Ceresa , using the forecast function will allow to do the same. Basically surfacing this function as a feature with one-click would achieve what is requested:
@Benjamin Arnulf-Oracle @Gianni Ceresa
I am using the forecast function as shown above and running in to challenges when viewing multiple departments within one table. For example, forecasting FTE by department. If I look at one department at a time the forecast seems accurate, but when I add multiple departments, it shifts the forecast and seems like it is considering the FTE for all departments to forecast the FTE for one. Has anyone else experienced this? Example below.
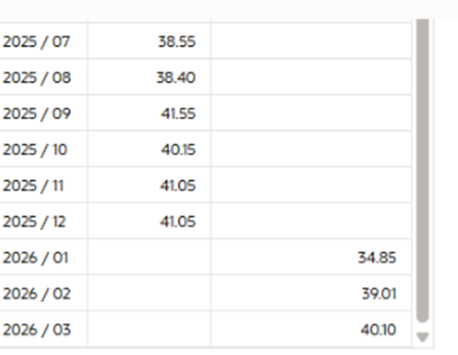
When the table contains multiple departments, the forecast for one department is as follows (nothing in the data suggests we will be at 34.85 next month):
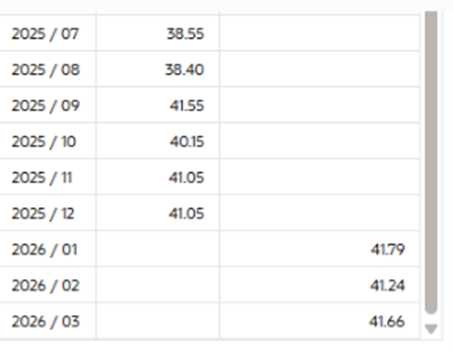
When we view this same department as the only department in the table, it seems accurate:
+ @Avinash Krishnaram-Oracle for additional expertise.
@Lalitha Venkataraman-Oracle - can you pls check if the customer needs to file a SR to triage this further?
@Lalitha Venkataraman-Oracle I wanted to check if there are any updates on this. We have a strong business need to use the forecasting feature within a table, but the current data accuracy is preventing us from moving forward. Could you advise on next steps or any actions we can take to resolve this?
@Gina DiVenti Hope you are doing wwell. I am trying to replicate the issue. I have tried few cases and could not narrow down to the scenario. In my dataset, I have 3 Departments: Furniture, Office Supplies and Technology. I am predicting Sales for each department.
Background:
Sales Overall Prediction (1 Period Ahead) - 223.68M Each Department Individually : Furniture (1 Period Ahead) - 66.6M Office Supplies (1 Period Ahead) - 126.2M Technology (1 Period Ahead) - 40M Sum = ~232.8M If you predict independently, you will always have some difference. That is the statistical variation. In simple words, Smaller Segments have high variation. I guess this is not what you are referring to.
Case
Descriptions
Observations
1
Forecast Calculation vs Right Click Forecast
Same values are reflected
2
Predicting Each department Independently and Summing them - All departments are just added to Color
Sales Overall Prediction (1 Period Ahead) - 223.68M
Each Department Individually :
Furniture (1 Period Ahead) - 66.6M
Office Supplies (1 Period Ahead) - 126.2M
Technology (1 Period Ahead) - 40MSum = ~232.8M
3
Predicting Each department Independently and Summing them
- All departments are just added to Trellis
Same behaviour as above
I am trying to replicate this Scenario you mentioned - "" When the table contains multiple departments, the forecast for one department is as follows (nothing in the data suggests we will be at 34.85 next month) "" Please share with me more details like - Formula( …) Model, preiods projected etc. This would help me narrow down and understand the issue better.
@Laxminag Mamillapalli thank you for helping look at this! I will try to explain better below what I am seeing.
The goal is to have a single consolidated table that includes multiple departments, with each department having its own independent forecast. The FTE values from other departments should not influence or alter the forecast for a department. We’ve observed that forecasts differ when multiple departments are included in a single table compared to when each department is analyzed individually. In the comparison below, the first table is filtered to three departments, while the second table is filtered to one department only. The individual department forecast (table 2) appears accurate, whereas the combined table seems to average across all departments, resulting in less accurate forecasts. We would expect that the forecasts for Department 3 would be the same across both tables, regardless of how many other departments are in the first table.
Department Name
Month
Assigned FTE
FTE Projection
Department 1
2024 / 10
4.00
2024 / 11
2024 / 12
2025 / 01
2025 / 02
2025 / 03
2025 / 04
2025 / 05
2025 / 06
2025 / 07
2025 / 08
2025 / 09
2025 / 10
2025 / 11
2025 / 12
5.00
2026 / 01
2026 / 02
2026 / 03
Department 2
37.10
37.50
40.20
40.95
43.00
43.30
42.60
42.30
44.70
42.00
43.70
42.80
44.75
38.85
40.16
40.93
Department 3
34.25
31.90
31.10
31.40
33.65
33.60
34.00
36.40
39.80
38.55
38.40
41.55
40.15
41.05
40.45
36.82
40.19
41.40
40.80
41.14
Currently using this formula, but I have seen similar issues when using ETS. I have also expanded the timeframe to include almost 3 years and have the same problem.
Does Oracle have any plans to introduce LLM-based AI features in a future release of Oracle Analytics Server (OAS) on-Premises? In particular, is there a roadmap for bringing capabilities such as the Oracle Analytics AI Assistant or an LLM-powered conversational chatbot, currently available in Oracle Analytics Cloud, to…
Summary of the Enhancement We request two key enhancements to the native Waterfall visualization in OAC Workbooks to support standard financial bridge reporting: Attribute-Driven Category Axis: Allow standard categorical attributes (with custom sorting) directly on the X-axis, removing the current dependency on Date/Time…
Currently in OAC, although we can create application roles in the OCI application (e.g Service Administrator), there is no way to programmatically create and configure custom application roles in OAC itself. This has to be done via the console system settings manually in OAC. We are running a large scale OAS > OAC…
Currently, in Oracle Analytics Cloud (OAC), there is a 250GB storage limit for datasets, but there are no practical management features to operate within this limit. This makes day‑to‑day operations very inconvenient.I would like to request the following enhancements for dataset storage management: Configurable storage…
I'm not very technical so if this is a non-starter or there's a solid workaround that already exists, please advise. We have users that query SQL data sources directly in other tools, but then would like to bring that query as a dataset to OAS. Ideally they could create the view in the database and reference that object…