Categories
- All Categories
- Oracle Analytics Learning Hub
- 19 Oracle Analytics Sharing Center
- 19 Oracle Analytics Lounge
- 232 Oracle Analytics News
- 44 Oracle Analytics Videos
- 15.9K Oracle Analytics Forums
- 6.2K Oracle Analytics Idea Labs
- Oracle Analytics User Groups
- 86 Oracle Analytics Trainings
- 15 Oracle Analytics Data Visualizations Challenge
- Find Partners
- For Partners
Query on Slope-Based Sales Trend Analysis in OAC
Hi Team,
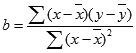
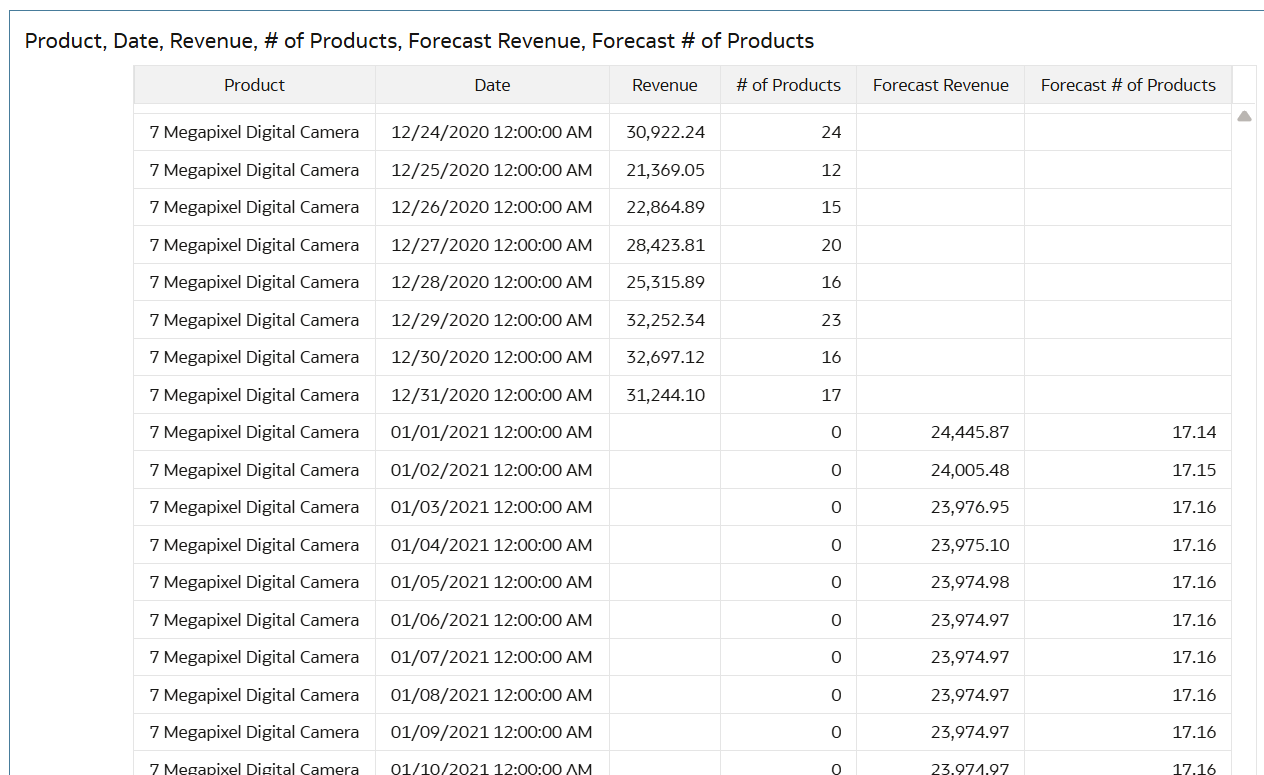
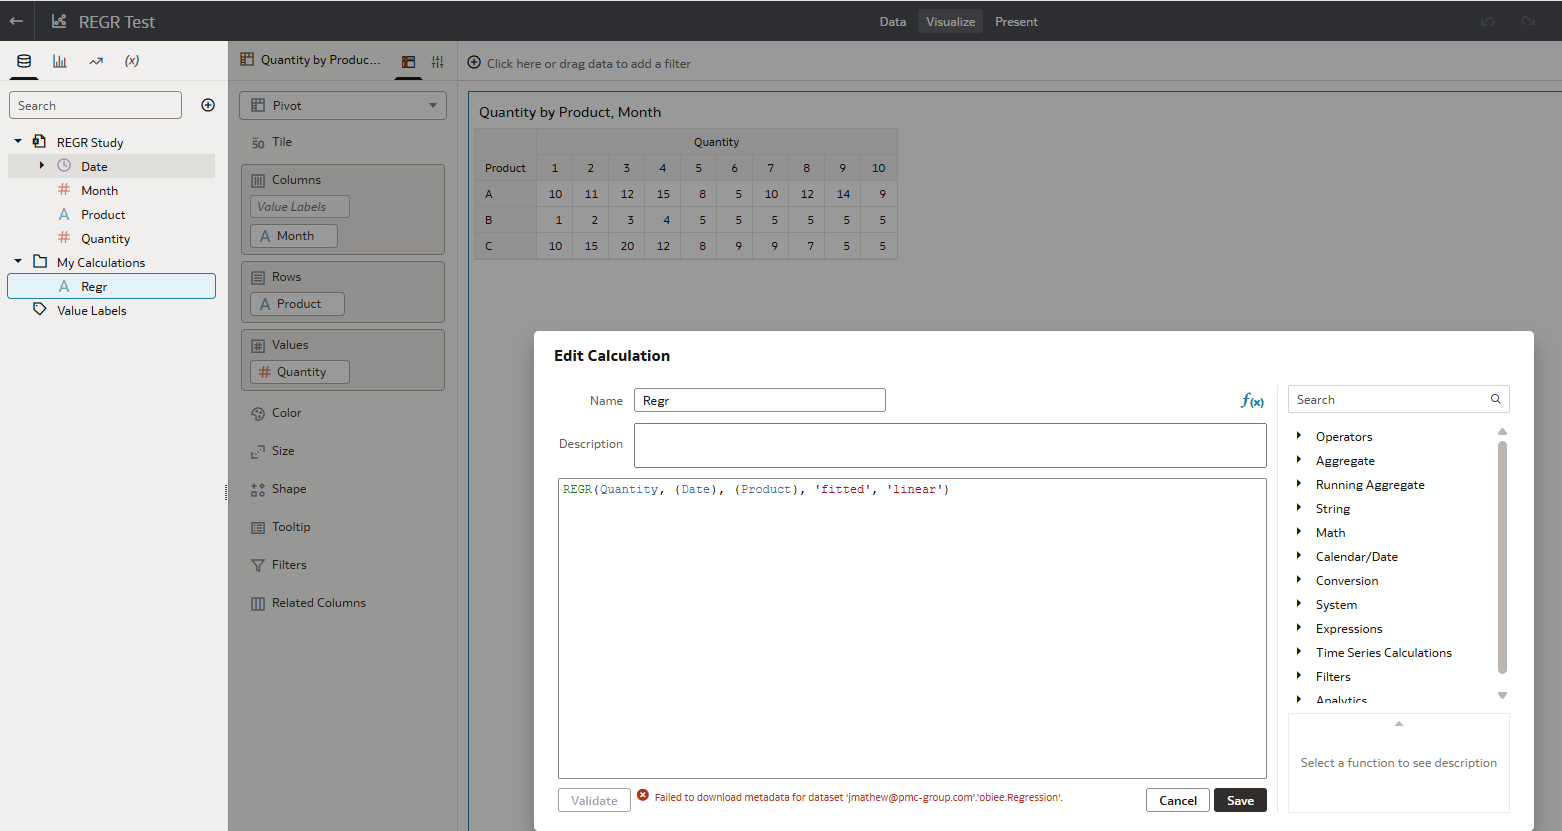
We have a requirement to identify customers whose sales have declined over a specific period in the last one year. Essentially, we need to compare the last 12 months of sales data and determine the trend — similar to how the SLOPE function works in Excel.
Could you please confirm if Oracle Analytics Cloud provides any built-in functionality for this type of analysis? Additionally, do we have any extensions or sample reports available for this scenario?
Thanks,
Jay
Answers
-
You can add overlay, projections, forecasting and reference lines to charts, and for other types of analytics https://docs.oracle.com/en/cloud/paas/analytics-cloud/acubi/enhance-visualizations-statistical-analytics.html#GUID-530477EB-EF4F-40FA-9131-F0E50F0C2506
1 -
Hi Brendan,
Thanks for the quick response. We have data for hundreds of customers to compare — will this chart help us identify the declining sales customers efficiently?
Thanks,
Jay0 -
The SLOPE function in Excel doesn't do anything magically, it's a documented simple calculation on a dataset with 2 values (referred as X and Y):
Take each x value, subtract the average of all the x's values, multiply by each y value subtracting the average of all the y's values. Sum all that together and divide by the sum of each x value subtracted the average x squared. There is your slope value.
You can therefore calculate that in OAC because OAC is able to calculate the average in a dataset, it is able to perform subtraction, multiplication and division. And it can also perform sum aggregation across a dataset.
There isn't a native function doing that, but you don't need it because the function itself is just a combination of simpler operations.
If you have hundreds of customers and want this value to be calculated all the time and take actions based on it, you can also materialize it in your data source: it will be calculated once and stored, making it faster to perform analysis on it.
2 -
And going in the direction hinted by Brendan: the FORECAST function let you easily forecast future sales by customer based on past data ( ).
That could give you an added value than just the slope of the regression line, because the forecast could take into consideration a not linear trend and seasonality etc.
2 -
Thanks @Gianni Ceresa . i will try out your suggestions and update my results.
0


