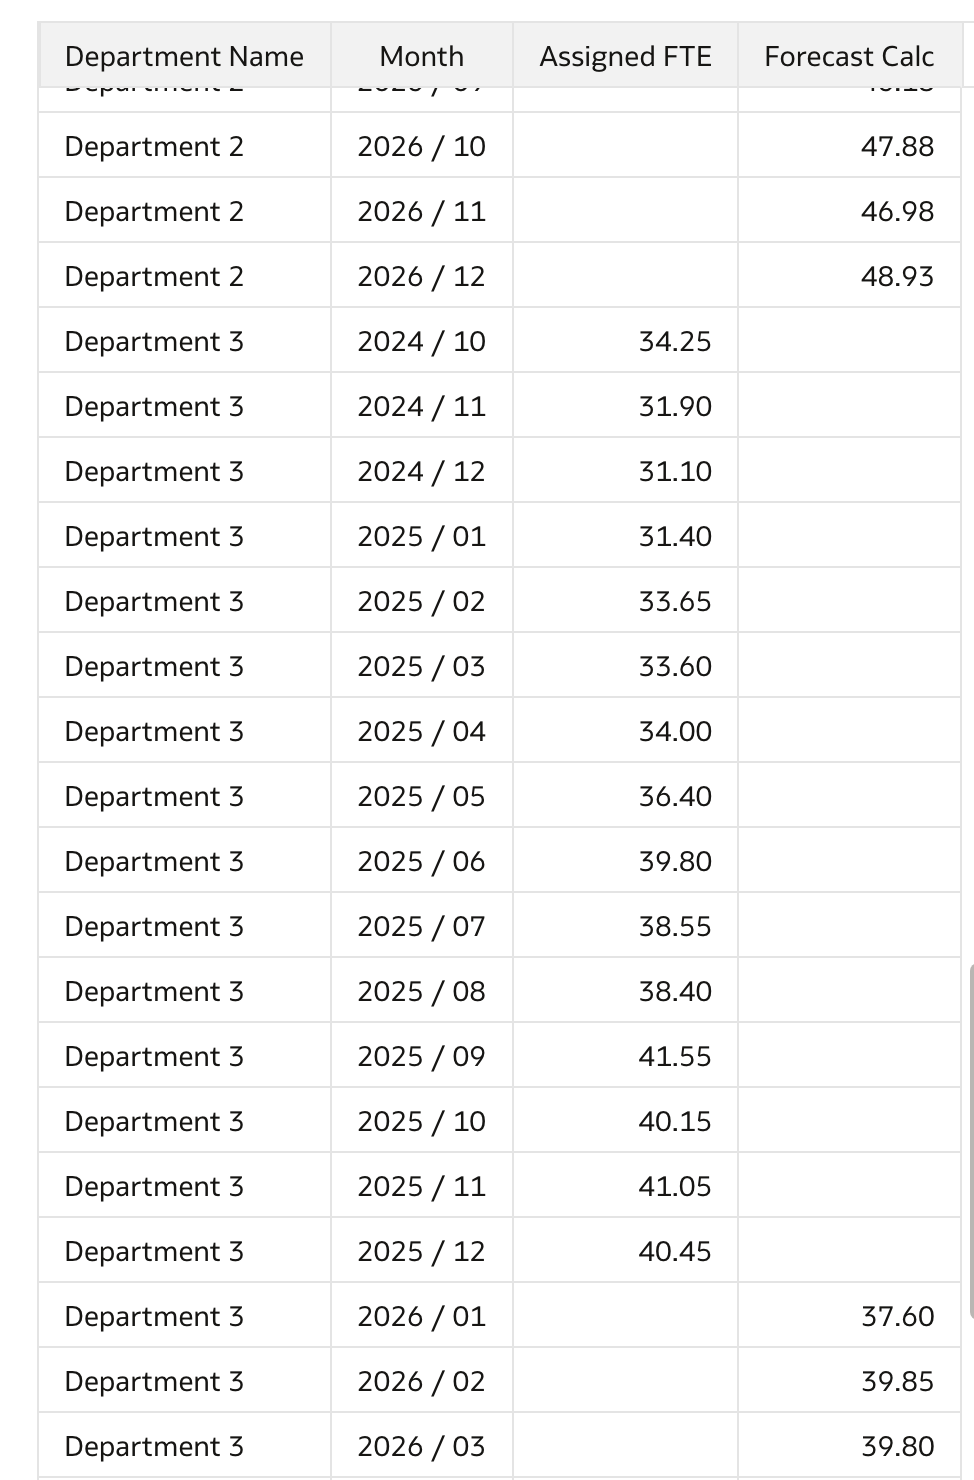
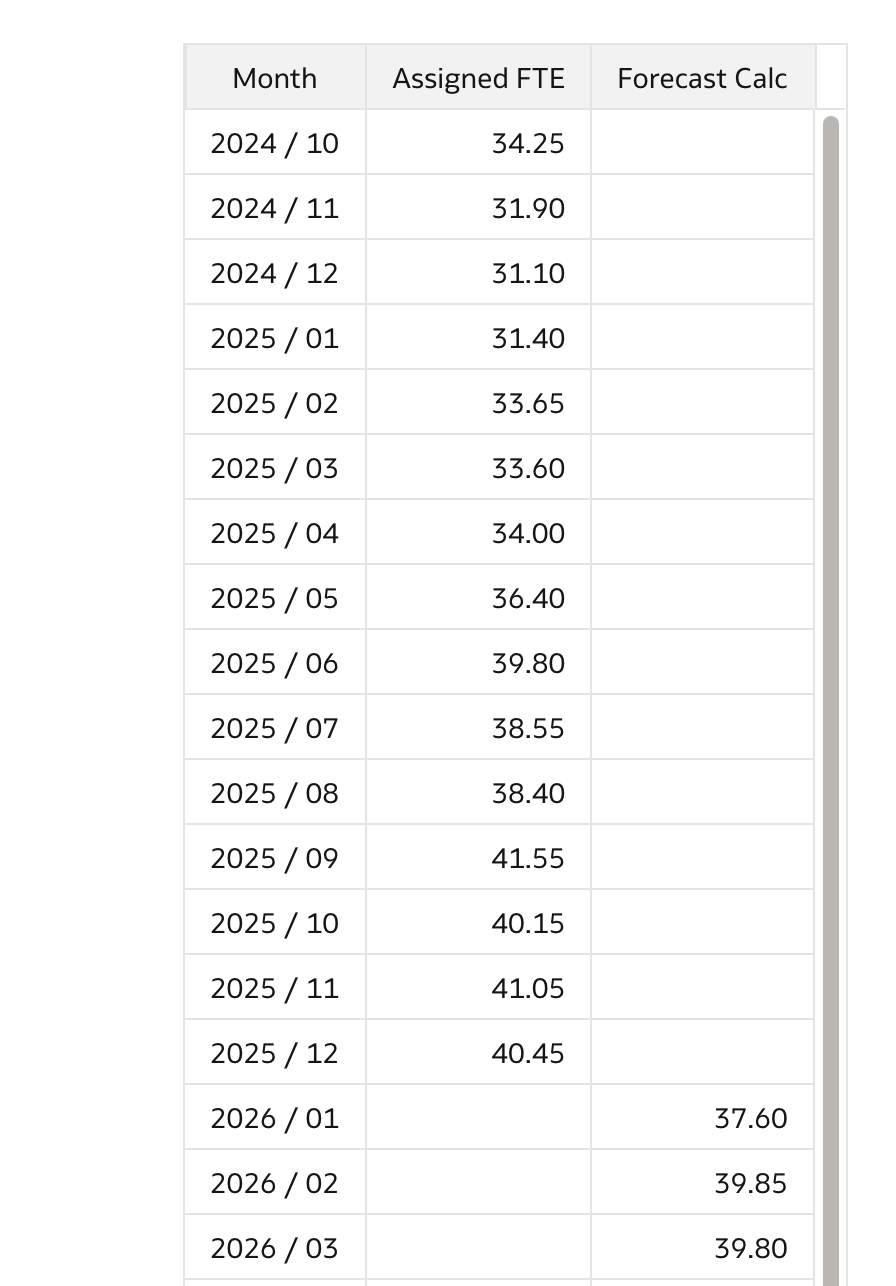
Enable users to export or view in a table format the forecasts generated from graphs using ETS, ARIMA, or Prophet models.
@Gina DiVenti
Thanks for your patience and the quick reply. I wasn’t able to reproduce the issue on my side, which makes me think there might be some underlying aggregations or other factors affecting the calculation.
To move forward, we have a couple of options:
I have separated Department 1 Data and stored it as a separate file. Below are the predictions when we have only department 1 data.
I see exactly same values when I use the same values. Explanation for Lower Values in Initial Forecasts:
The lower values in the initial forecast occur because an ARIMA model is being used. In ARIMA, the autoregressive (AR) component places greater weight on recent observations, while the moving average (MA) component smooths the series by incorporating past forecast errors. Recent historical values are in the mid-30s, the model anchors the early forecast periods around these levels. As a result, the projected values in the immediate future appear slightly lower before gradually adjusting over time.
In scenarios where strong trend or seasonality effects are present, a Prophet model is often more suitable, as it explicitly models trend changes and seasonality and can adapt more quickly to such patterns.
@Laxminag Mamillapalli I just realized I stumbled upon this solution to my problem in the OAC idea lab, but I am working in FDI. I'm assuming this should still work in FDI since the forecast feature exists, but wondering if that is the difference. Does that change anything regarding next steps (options you presented above)?
FDI data has aggregations and slightly more complex scenarios which may have influenced. At this point I can only speculate. Please feel free to raise a bug and explain the conditions. Make sure add as many details about build, versions, environment etc to narrow down. Have a great day.
@Luis E. Rivas -Oracle can you connect with @Laxminag Mamillapalli and@Lalitha Venkataraman-Oracle to see if we have an internal repro of if we need more information.
and
I am creating two tables in a freeform report and overlaying these tables to appear as one to the end user. I can hide the header titles by setting the font and highlight colour to the same as the background colour but it would be better if there was a functionality to disable the header row completely.
My organization needs a practical way to generate a comprehensive report listing all members—including both direct and inherited assignments—of every custom application role within the Oracle Analytics Cloud (OAC) Console’s Roles and Permissions area. Today, the only built‑in method is exporting one role at a time through…
Currently you are able to change the width of a field in a table or pivot table by dragging the border but there is no option to manually fix it to a set value e.g. 100px. Justification: I am creating a report with two tables in freeform and need the field widths to have the same size when I overlay one table on the other.…
Request for an enhancement to Oracle Analytics Cloud (OAC) Classic Analysis Selection Steps on measure suppression for a specific calculated member created through Selection Steps. This idea is opened based on the directions from oracle CEAL team, for more details please find the below service request. SR -…
Hi, We use a lot of Custom App Roles in OAC Console and It would be easier to have an API to manage the members of App Roles.