We have a requirement to produce a Pivot Visualisation that includes an unbroken series of dates, from a filterable period, and the value of whatever measure is relevant.
For example, in a period of 16/03/26 - 22/03/26 being able to see the number of activities a Resource has handled, including dates when the value is 0/NULL. Using an activity table we can get the below. which is expected as this Resource handled no activities on the missing dates:

We're struggling to get the 2 missing dates included as 0/NULL as well. We have previously had this working using an Excel file of dates up to 2030 linked in the Workbook to the dataset on the relevant date column, ROUTE_DATE, in this case. But, while that legacy report still functions, we're unable to replicate it on newer tables.
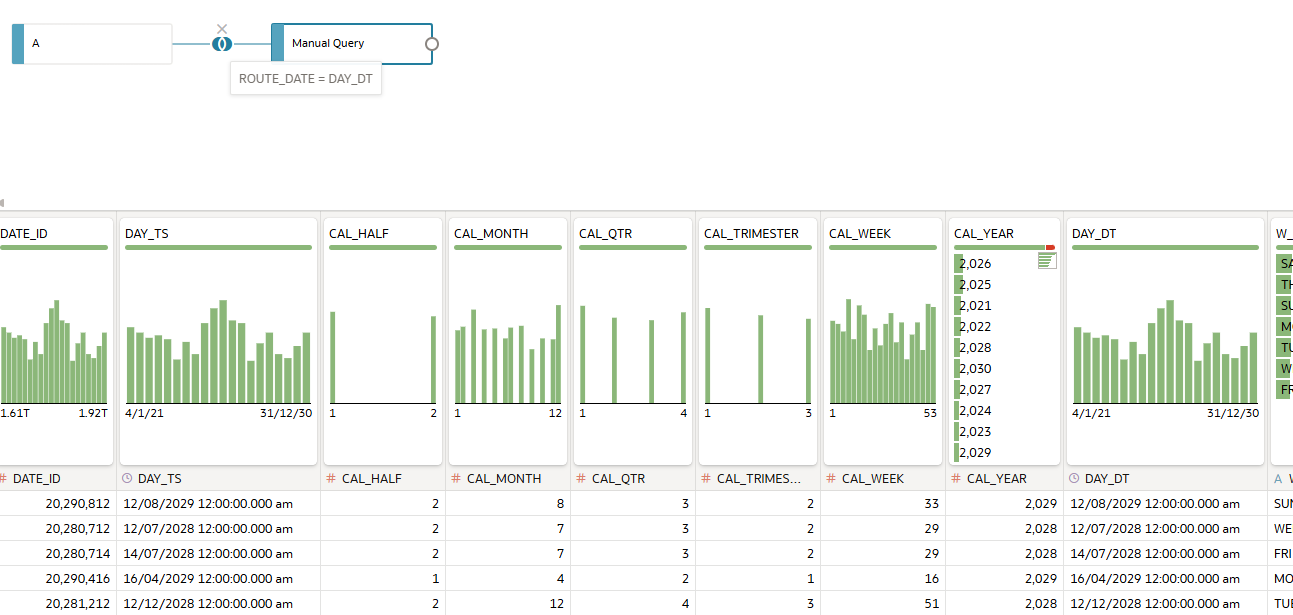
In an effort to replace the Excel file, in a Dataset we have identified a "Time" table from our ADW instance and linked it with a Full Outer Join to the Activity table, but the result is the same as above.
We feel like we're missing something obvious here, as even Googles AI response says this is all that is needed, but we continue to fail.
Can anyone advise how to achieve an unbroken series of dates for a measure, even if there is no data stored for some of the dates?