Hi All,
I am using OAS with the latest 2023 version. I am facing an issue I created a data set that displays some data with 3 rows but I want another column for headings of that data for eg the first row could be Feb 2022 , 2nd row could be Total AVI could be % of AVI etc..
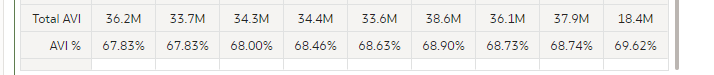
I wanted to have labels for each of those on the first column as Month year, Sales and Sales %. One solution that someone gave me was to create a Blank Label and put it under computations as NULL value and then add that under rows. It works perfectly fine but it creates an empty small row which is blank at the bottom. That's not a good look.
I've attached an example of how that looks in the attached file. If anyone have any other ideas on how to acheive the same without this blank row I would appreciate it.