Categories
- All Categories
- Oracle Analytics and AI Learning Hub
- 54 Oracle Analytics and AI Sharing Center
- 26 Oracle Analytics and AI Lounge
- 316 Oracle Analytics and AI News
- 57 Oracle Analytics and AI Videos
- 16.4K Oracle Analytics and AI Forums
- 6.7K Oracle Analytics and AI Labs
- Oracle Analytics and AI User Groups
- 121 Oracle Analytics and AI Trainings
- 24 Oracle Analytics and AI Challenge
- Find Partners
- For Partners
How to have Drill Down option on Aggregated column/field in OTBI Analysis/Dashboard
Answers
-
I have quite a bit of experience reconciling PPM vs GL. I'd be happy to setup some time with you over teams. Please send me a message with some of your availability. I work in EST timezone.
I found that we were able to achieve by using DFF's on projects that relate to the GL dimension in summary level as start. We can also further drill down to actual projects and then transactional data along with discrepancies/etc.
For example on our project/task we create DFF that relates to our secondary balancing segment. I use OTBI analysis (using both GL transactional balances and Project Revenues/Costs subject areas). I filter GL side as of a period, using a filter for net position accounts and P&L accounts (to represent running balance in GL). You can also do a comparison by month too.
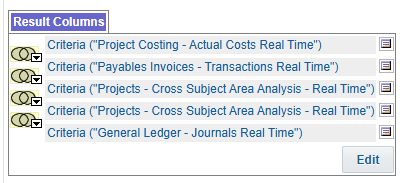
I'm attaching an analysis that I use. Please note that I'm sharing so you can see the design for a high level summary. But as I mentioned it is dependent on the project organization and project DFF's that may not be same at your organization.
Also the measure for revenue minus cost from the project subject area is based on the accounting periods in our system (they do differ in each year, so I need case formula). This case formula also handles where GL adjustment period is 14 and we need to look at GL as of adjustent period 14 vs project module ITD as of June.
Simliar method using multiple subject area you can also reconcile by transaction/etc
 0
0
