Categories
- All Categories
- 150 Oracle Analytics News
- 28 Oracle Analytics Videos
- 14.7K Oracle Analytics Forums
- 5.7K Oracle Analytics Idea Labs
- Oracle Analytics User Groups
- 54 Oracle Analytics Trainings
- 12 Oracle Analytics Data Visualizations Challenge
- 4 Oracle Analytics Career
- 2 Oracle Analytics Industry
- Find Partners
- For Partners
When we add multiple measures, chart should not display if there is no values.

We should have option not show the line for null values.
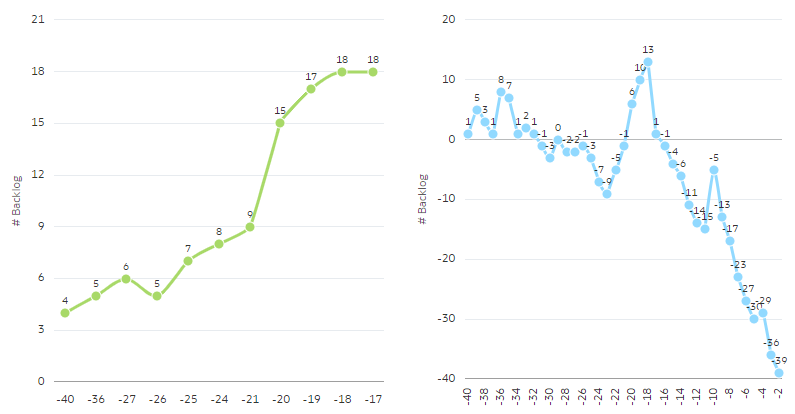
In Line diagram it is showing all values for all measures even though we don't have values for it. In the attached example, after week 20 , there is no value for green lines. But it is showing continuous line.
In overlay diagram it is showing zero. No option to not to show as Gap.
Comments
-
Have you tried this option? but I think your request is not for Gap, you are asking that it use the same value as the previous value in case there is a Null. It is different from Gap and should be solved in the definition of the measure/calculations.
0 -
Yes , My issue is using same value even though it is Null.
If I plot two different line DVs, it looks below.
But If I add same measures in one DV, It is not ignoring nulls.
Can you suggest how it can be solved in Calculation/Measure definition?
0 -
Hi,
Same happened to me as well. It would be good to have a solution.
Best regards,
Jorge
1 -
@Rajakumar Burra can you share an example dataset? I was not able to create the same outcome.
0 -
@Jorge Olmeda Do you have any quick example. I am unable to reproduce now.
0