Categories
- All Categories
- Oracle Analytics Learning Hub
- 30 Oracle Analytics Sharing Center
- 20 Oracle Analytics Lounge
- 242 Oracle Analytics News
- 45 Oracle Analytics Videos
- 16K Oracle Analytics Forums
- 6.3K Oracle Analytics Idea Labs
- Oracle Analytics User Groups
- 90 Oracle Analytics Trainings
- 16 Oracle Analytics and AI Challenge
- Find Partners
- For Partners
The aggregation for Assignment count don't add up correctly in grand total

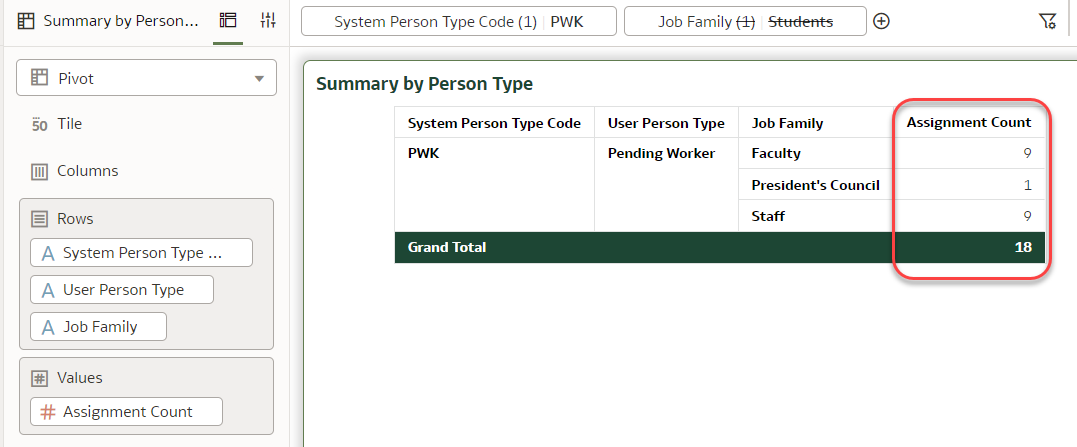
The default metrics assignment count displays the correct current total in subtotals/totals when a time dimension is not chosen. However, there are additional rows (in this case, President's Council) displayed creating a very confusing visualization because 9+1+9 is 19, not 18.
This happens in both pivot and table view. That's just not how common users would understand 'Total'. 'Total' should simply be adding what's displayed above.
Per this document (https://docs.oracle.com/en/cloud/saas/analytics/24r3/fahia/appendix-report-authoring-tips-hcm.html#GUID-D5CCC20F-58B6-498A-9E5F-9CA532E8EF23), users are advised to add To_DateTime(VALUEOF(NQ_SESSION.CURRENT_GREGORIAN_DAY), 'DD-Mon-YY') to improve performance. This doesn't seem like a performance issue, but it is simply not totaling correctly.
Whether a time dimension is introduced, the grand total line should not reflect 18 (in this screenshot). It'll leave users wondering if the total is adding up correctly in other instances, undermining confidence in FDI visualization.
An SR (SR 3-38253258061) was opened for this and was adviced to submit an enhance request ticket instead.
Comments
-
Was this resolved? I am encountering same scenario on my workbook.
0