Categories
- All Categories
- Oracle Analytics and AI Learning Hub
- 54 Oracle Analytics and AI Sharing Center
- 26 Oracle Analytics and AI Lounge
- 317 Oracle Analytics and AI News
- 57 Oracle Analytics and AI Videos
- 16.4K Oracle Analytics and AI Forums
- 6.7K Oracle Analytics and AI Labs
- Oracle Analytics and AI User Groups
- 121 Oracle Analytics and AI Trainings
- 24 Oracle Analytics and AI Challenge
- Find Partners
- For Partners
OAS: Using SUM / RSUM In A Workbook Visualization

Best Answer
-
@User_VMJII ,Please create a new calculated column and use Rsum or running sum function like Rsum("measure name")
2

Answers
-
@Ram-Oracle thank you very much for your quick reply!
0 -
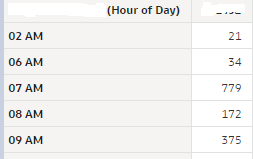
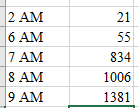
If I go further, I would like to check another option. I would like to add average data to the above data (RSUM) (eg the average of the last 30 days at certain times) - is this possible? My time information is written as 08/12/2024 12:00:00.000 AM. I tried the calculation:
avg(case when TIME >= (CURRENT_DATE - 30/24) then X else null end),
which is validated, but the result is not correct (the value is the same at all hours). I also played with the calculation:
(case when TIME >= TIMESTAMPADD(SQL_TSI_HOUR, -720, CURRENT_DATE) then X else null end),
but unfortunately it was unsuccessful. Do you have any other suggestions? Maybe @Ram-Oracle ?
0