Dear OAC Product Development Team,
Feature Request: Button-Linked Bookmarks for Enhanced Dashboard Navigation
I'd like to propose implementing a comprehensive bookmarking system in Oracle Analytics Cloud that integrates with interactive buttons, similar to functionality available in Power BI. This feature would dramatically improve dashboard usability and analytical storytelling capabilities.
Proposed Functionality:
1. Bookmark Creation and Management:
- Ability to capture and save the complete state of a dashboard including all filter selections, visible/hidden elements, and visual states
- Options to create, rename, update, and delete bookmarks
- Support for both personal bookmarks (user-specific) and shared bookmarks (available to all dashboard consumers)
2. Button Integration:
- Add interactive buttons that can be placed anywhere on dashboards, especially in navigation bars
- Configure buttons to trigger specific bookmarks when clicked
- Apply conditional formatting to buttons to indicate active/inactive states
- Customize buttons with text, icons, or both to create intuitive navigation
3. Navigation Experience:
- Create tab-like experiences at the top of dashboards for switching between different analytical views
- Enable guided analytical paths through sequential bookmark navigation
- Support advanced interaction patterns like drill-through between bookmarked states
- Allow URL parameters to directly access specific bookmarked views
Business Value:
This functionality would provide significant benefits for OAC users:
- Reduced Dashboard Complexity: Transform complex dashboards into organized, focused views
- Improved User Adoption: More intuitive navigation leads to higher engagement
- Enhanced Data Storytelling: Guide users through insights in a structured way
- Optimized Development: Create multiple views within a single dashboard rather than building separate dashboards
- Better Collaboration: Share specific analytical states with colleagues through bookmarks
Example Use Case:
A financial dashboard could have buttons for "Executive Summary," "Detailed Financials," "Regional Breakdown," and "Forecast" views. Each button would trigger a bookmark that reconfigures the entire dashboard to show relevant visuals, apply appropriate filters, and focus on the metrics that matter for that specific analytical context.
This approach would transform static dashboards into dynamic, interactive analytical applications that better serve diverse user needs.
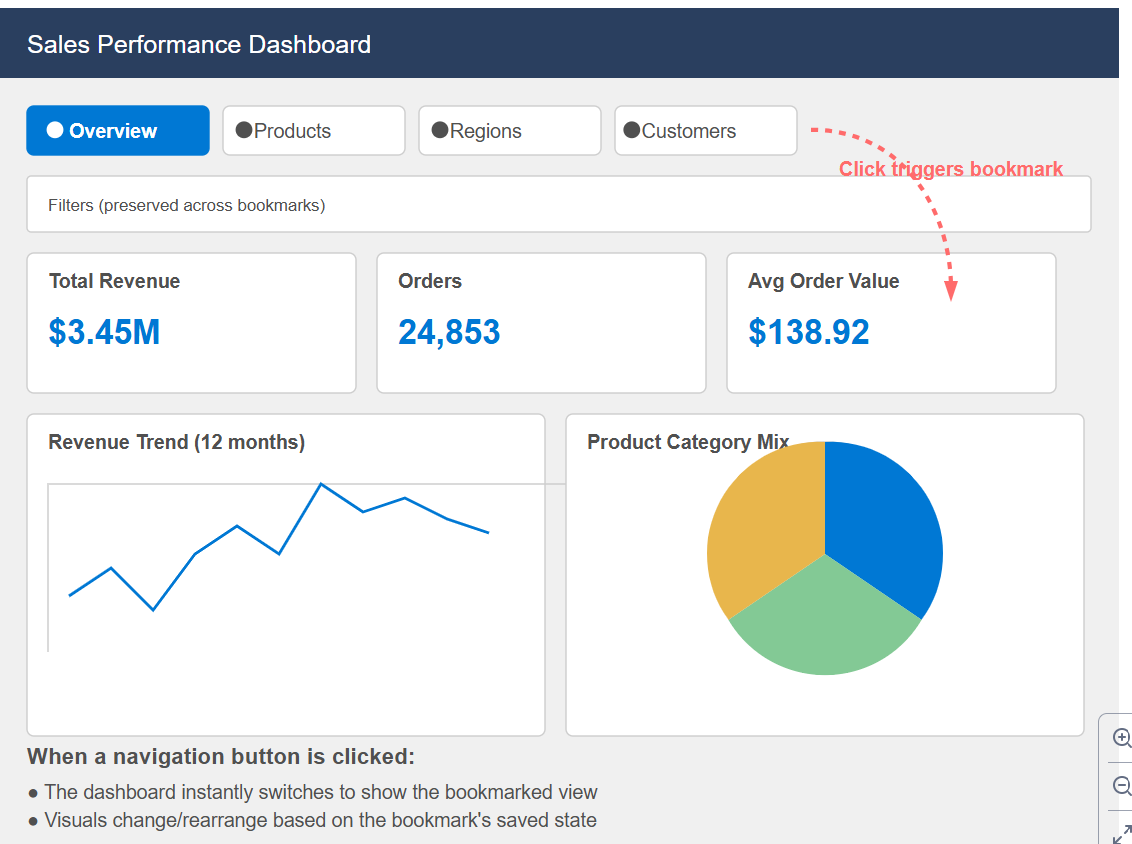
Mockup: