Categories
- All Categories
- Oracle Analytics and AI Learning Hub
- 44 Oracle Analytics and AI Sharing Center
- 20 Oracle Analytics and AI Lounge
- 278 Oracle Analytics and AI News
- 56 Oracle Analytics and AI Videos
- 16.2K Oracle Analytics and AI Forums
- 6.4K Oracle Analytics and AI Labs
- Oracle Analytics and AI User Groups
- 103 Oracle Analytics and AI Trainings
- 20 Oracle Analytics and AI Challenge
- Find Partners
- For Partners
Tile Visual Capabilities

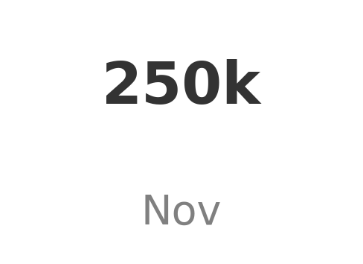
In OAC, we'll be using a tile visual to display measure values. Along with that, I also want to show the associated attribute value in the tile as a secondary label.
For example, let's say I have monthly values and I'm displaying the highest monthly value in the tile graph. Below that value, I want to show the corresponding month. How can this be achieved? Any ideas, suggestions, or comments would be greatly appreciated.
Best Answers
-
Hi @Kaliraj Ramu ,
A parameter value can be dynamically passed to a tile visualization primary and secondary measure labels.
See if this example is what you are looking for.4 -
There are helpful examples in the Gallery for what you can achieve.
Here is one with tiles that is similar to your mock up example.
https://community.oracle.com/products/oracleanalytics/discussion/25834/us-sales-dashboard-webinar-june-4-20250
Answers
-
Hi @Kaliraj Ramu , you posted into the Videos forum. I move your request to the OAC Forum.
1 -
My apologies, Thank you!
1 -
Hi @SteveF-Oracle ,
I'm aiming for something like this (Dynamic One). And the link you shared was helpful, I'll see what I can do with that and make a few adjustments as needed. Thank you for the effort that you put into finding it.
1


