Categories
- All Categories
- Oracle Analytics Learning Hub
- 19 Oracle Analytics Sharing Center
- 17 Oracle Analytics Lounge
- 233 Oracle Analytics News
- 45 Oracle Analytics Videos
- 15.9K Oracle Analytics Forums
- 6.2K Oracle Analytics Idea Labs
- Oracle Analytics User Groups
- 87 Oracle Analytics Trainings
- 15 Oracle Analytics Data Visualizations Challenge
- Find Partners
- For Partners
What should be the appropriate way to group the rows together so they show in same page?
Hi,
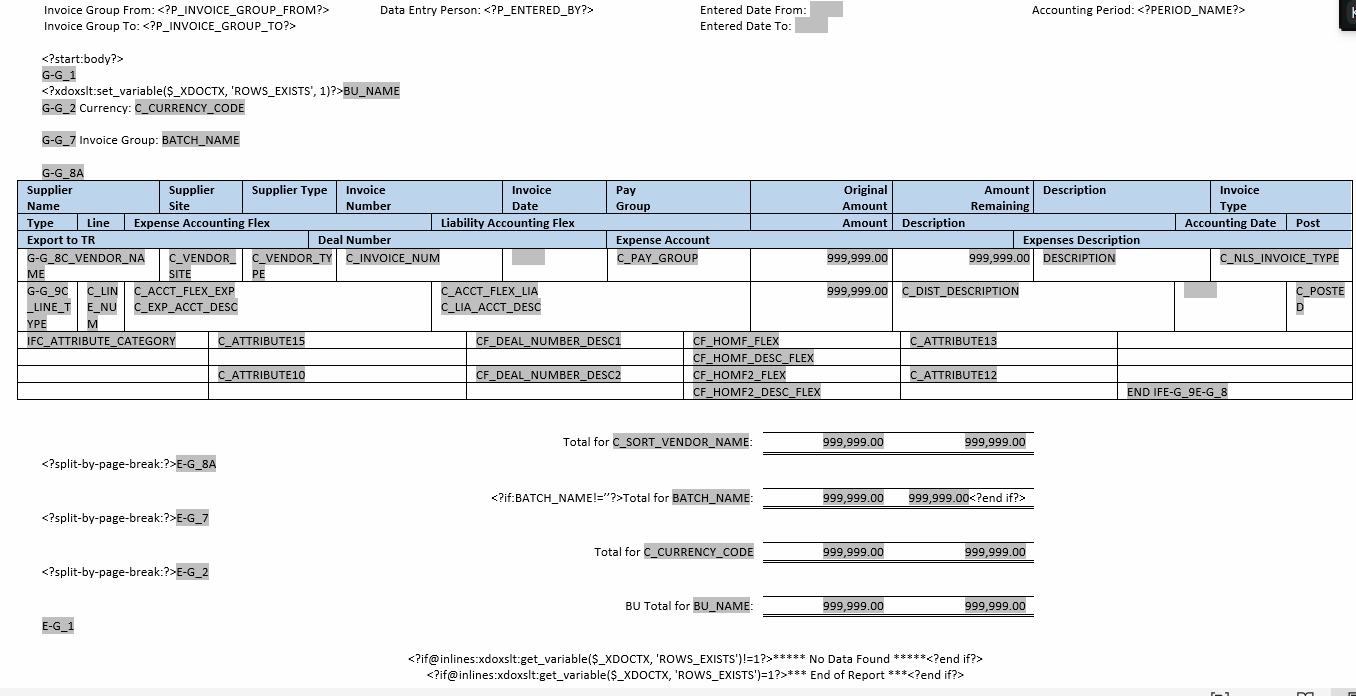
I have a custom report, it contains a table, show both the invoice header and invoice distribution information. But they are in separate rows.
For example:
In same table,
Column Headings of Invoice Header
Column Headings of Invoice Distribution
Result Row of Invoice Header A
Result Row of Invoice Distribution A of Invoice Header A
Result Row of Invoice Distribution B of Invoice Header A
…
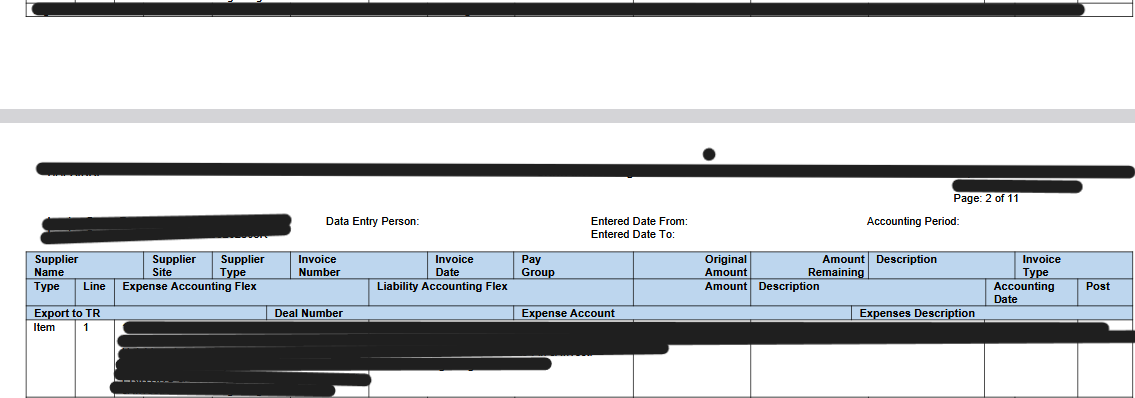
Now I want to have rows of same invoice to be shown in the same page, but the result is the header result row is shown in page 1, but the distribution rows of the invoice header shown in next page, how to modify the layout in RTF template to solve it
Related SR: 4-0001210487
Answers
-
Above is the RTF template: Invoice Header row is in group 8, invoice distribution is in group 9.
Here the result shows the header line on page 1, but the distribution group on page 2. how to set in RTF template, so they are shown both in page 2?
0 -
Fair response
0


