Oracle Fusion Analytics (Fusion Analytics), a part of the Oracle Fusion Data Intelligence Platform, is a family of prebuilt, cloud-native analytics applications for Oracle Fusion Cloud Applications that provide ready-to-use insights to help improve decision-making. It’s extensible and customizable, allowing customers to ingest data and expand the base semantic model with additional content.
In addition to the pre-built content FDI offers in each pillar, we have an ongoing effort to provide more reusable artifacts for FDI which is described in this blog.
In this post we are sharing a reusable workbook that analyses the EBITDA performance and the impact of various components of EBITDA, for the chosen period with the same period last year. The target audience are General Accounting Manager, Financial Analyst who analyze the EBITDA and its related KPIs performance.

NOTE: If you experience any issues importing this workbook or running it, it may be likely that your environment is on a version of FDI and/or OAC that is lower than the version used for developing this workbook. Update/upgrade timings are dependent on the data center your instance is in. We recommend waiting until your instance is upgraded to the latest version before importing and using this workbook.
Functional Areas
General Ledger
Subject Areas
- Financials – GL Profitability
Business Use Case
Empower Financial Analysts and General Accounting Manager to analyze the EBITDA performance year on year and understand the impact of various components impacting the EBITDA performance.
Pre-Requisites:
- Before using this workbook ensure that filter values are appropriately set for fiscal calendar, fiscal period, and ledger, to run the optimal query. Validate the data for accuracy before rolling out to business users.
Attachments
“EBITDA Performance Analysis” workbook details.
This Dashboard analyses the EBITDA performance year on year for the chosen Fiscal Calendar, Fiscal Period and Ledger. The default formula for EBITDA is –
EBITDA = Revenue - Cost of Revenue - Sales and Marketing Expenses - Other Operating Expenses - R & D Expenses
EBITDA Analysis: This canvas shows the EBITDA for the selected Ledger, Fiscal Calendar and Fiscal period and compares it with the same period Last year. It also shows a waterfall Viz. showcasing the positive and negative impact of the components of EBITDA. Below the waterfall Viz. the impact of corresponding financial categories related to the EBITDA components is also shown.
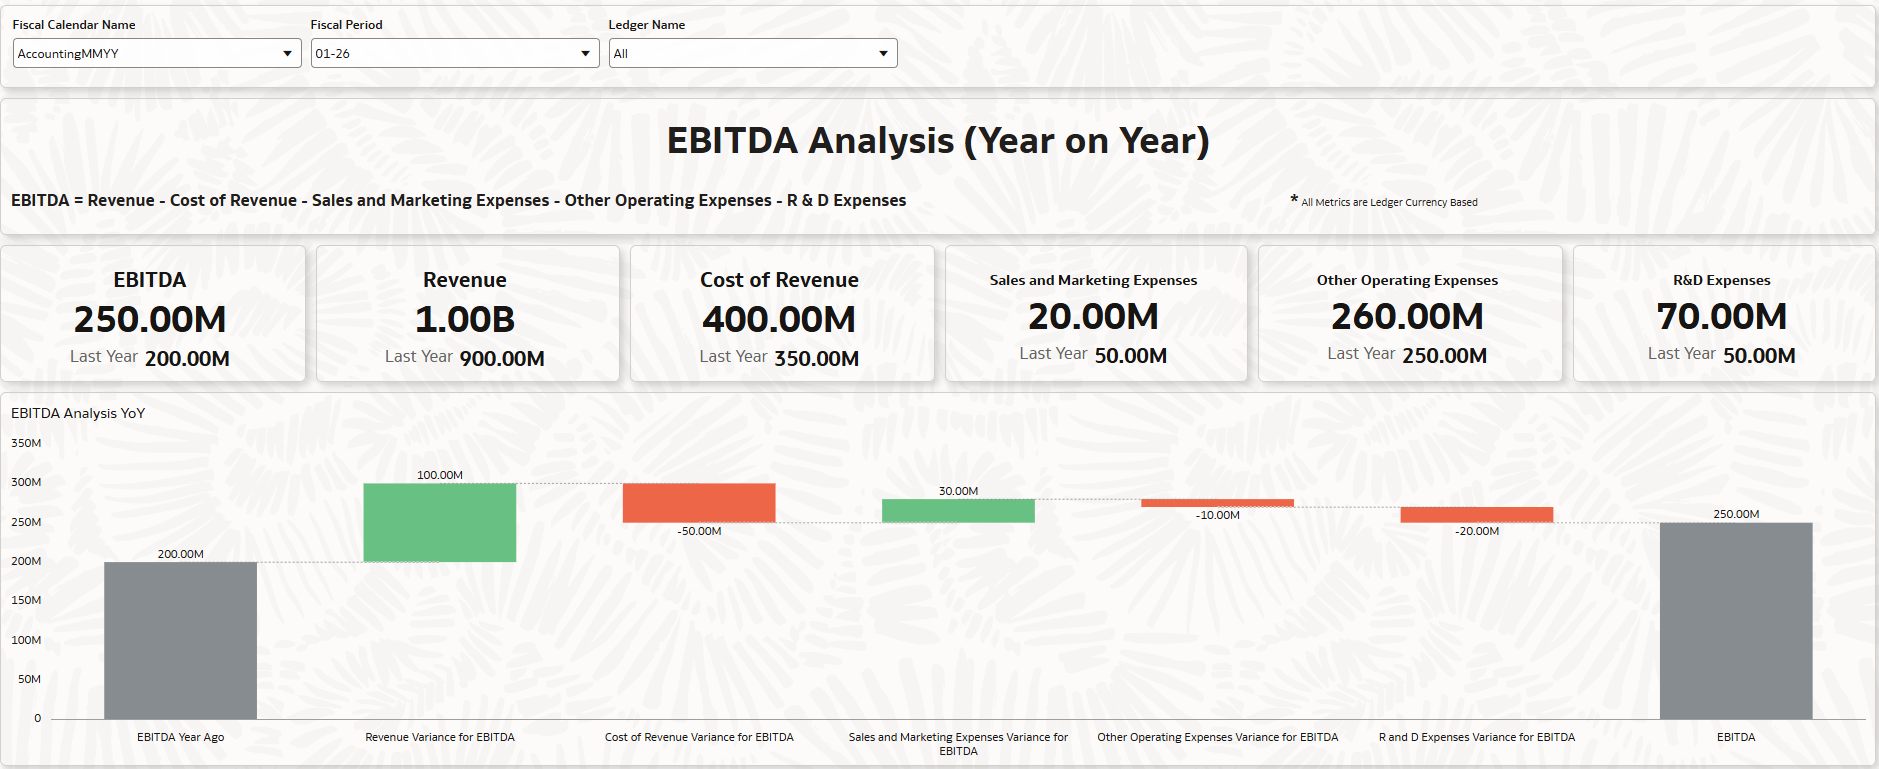
In the above screenshot you can see that Revenue, Sales and Marketing Expenses have positively impacted the EBITDA for the chosen period, when compared to the same period last year, whereas Cost of Revenue, Other Operating Expenses and R&D Expenses has negatively impacted.
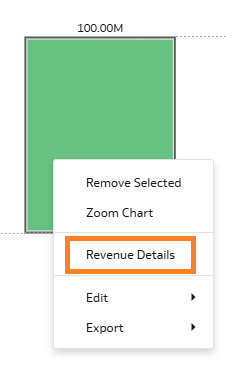
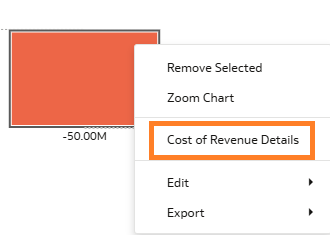
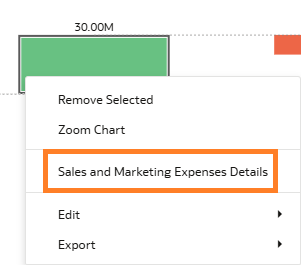
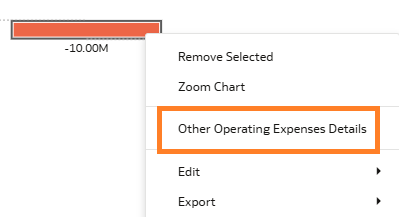
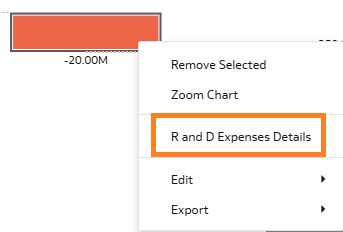
Within the EBITDA Analysis YoY (Waterfall Viz.), you can right-click on the bar of
- Revenue Variance for EBITDA and select Revenue Details to get Account level details for Revenue.
- Cost of Revenue Variance for EBITDA and select Cost of Revenue Details to get Account level details for Cost of Revenue
- Sales and Marketing Expenses Variance for EBITDA and select Sales and Marketing Expenses Details to get Account level details for Sales and Marketing Expenses.
- Other Operating Expenses Variance for EBITDA and select Other Operating Expenses Details to get Account level details for Other Operating Expenses.
- R and D Expenses Variance for EBITDA and select R and D Expenses Details to get Account level details for R and D Expenses.
Revenue Details: This canvas provides details of the Revenue amounts for the selected Fiscal Period, Year ago as well as the variance.
Cost of Revenue Details: This canvas provides details of the Cost of Revenue amounts for the selected Fiscal Period, Year ago as well as the variance.
Sales and Marketing Expenses Details: This canvas provides details of the Sales and Marketing Expenses for the selected Fiscal Period, Year ago as well as the variance.
Other Operating Expenses Details: This canvas provides details of the Other Operating Expenses for the selected Fiscal Period, Year ago as well as the variance.
R and D Expenses Details: This canvas provides details of the R and D Expenses for the selected Fiscal Period, Year ago as well as the variance.
General Guidelines and Best Practices
Here some guidelines and recommendations to adapt these workbooks to your environment. Additionally, review the information provided on the workbook Help page (if any) to ensure the workbook renders data after you select the appropriate options and filters.
- Download the workbook from the above attachment section and import the workbooks to your instance. Note: These workbooks don’t have passwords, in general. Password, if any will be explicitly called out.
- Ensure you download only the workbooks relevant to the pillar and functional areas activated for your FDI instance.
- All the workbooks will have a Help page containing required information and guidance on how to use the workbook. Be sure to follow these instructions before using the workbooks on your instance.
- Note, workbooks cover only generic use case / business scenario. Review the workbook content, make any changes as needed, and set the appropriate filters – especially those related to time dimensions and other dimensions based on the pillar / functional area.
- While making modifications, follow the best practices and generic / pillar specific authoring tips. Here are the pillar specific authoring tips link. Ensure to use the latest FDI documentation links for latest information on authoring tips and guidelines
- Fusion CX Analytics Authoring Tips
- Fusion ERP Analytics Authoring Tips
- Fusion HCM Analytics Authoring Tips
- Fusion SCM Analytics Authoring Tips
- It is highly recommended that you perform basic sanity checks and data validity before rolling out workbooks to business users and analysts.