Categories
- All Categories
- Oracle Analytics and AI Learning Hub
- 54 Oracle Analytics and AI Sharing Center
- 26 Oracle Analytics and AI Lounge
- 314 Oracle Analytics and AI News
- 58 Oracle Analytics and AI Videos
- 16.4K Oracle Analytics and AI Forums
- 6.7K Oracle Analytics and AI Labs
- Oracle Analytics and AI User Groups
- 119 Oracle Analytics and AI Trainings
- 24 Oracle Analytics and AI Challenge
- Find Partners
- For Partners
OAS 2025 DV - Data Labels Inside Bars with Bar Chart Visualizations
I am working with a horizontal bar chart in DV with an amount field for my X-Axis and programs for my Y-Axis. I see that I can create and adjust data labels for the amount with no problem and move the data label inside the bar, but again this is only for the amount / field on the X-Axis. I don't see a feature like this available for any values on the Y-Axis (or at least can't find it).
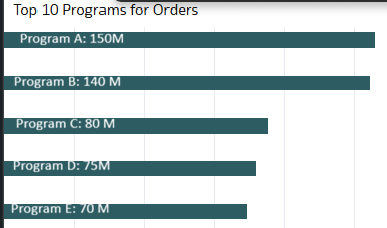
My goal is to have a data label inside the bar similar to the attached picture below (I made this manually with Paint), where I can have the programs from the Y-Axis on the bar along with the amount from the X-Axis follow right after.
Does anyone know what the solution may be for this?
Answers
-
Hi @User_SPO74
I haven't seen anything that would match this requirement with the out of the box bar chart. From what I can tell, you can only have the value labels not the axis labels.
If that is the case, the only way this would be possible is to have someone create an extension and load it via the console. I think it is Java that would be used to create this but I am sure someone from Oracle will be able to confirm.
0 -
Add the suggestion to the Analytics Ideas Lab forum
0


