Categories
- All Categories
- Oracle Analytics and AI Learning Hub
- 44 Oracle Analytics and AI Sharing Center
- 20 Oracle Analytics and AI Lounge
- 278 Oracle Analytics and AI News
- 55 Oracle Analytics and AI Videos
- 16.2K Oracle Analytics and AI Forums
- 6.4K Oracle Analytics and AI Labs
- Oracle Analytics and AI User Groups
- 103 Oracle Analytics and AI Trainings
- 20 Oracle Analytics and AI Challenge
- Find Partners
- For Partners
Ability to create a metric-based dynamic tolerance band

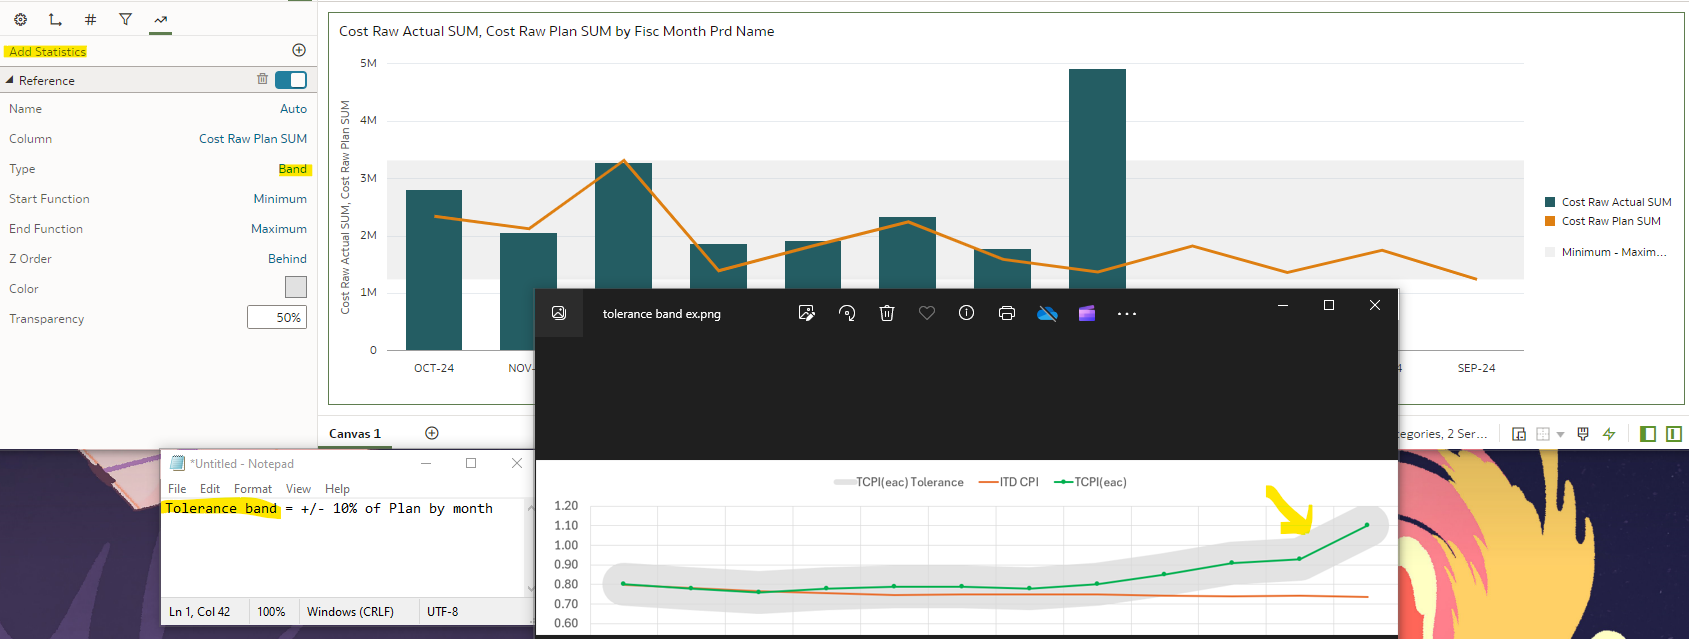
We have a business requirement to produce a chart which includes a +/- 10% tolerance band around a metric that is depicted by a line on a graph. I see there are some reference line options under Statistics already but no options to base the band on the individual data points for a metric.
For example, if the metric has monthly values of:
Month 1 = 100
Month 2 = 90
Month 3 = 110
The +/- 10% tolerance band would cover:
Month 1 = 90-110 would be shaded
Month 2 = 81-99 would be shaded
Month 3 = 99-121 would be shaded
Comments
-
0
-
A generic solution might plot a tolerance band on two separate data series. E.g., low = (value - value*0.1) and high = (value + value*0.1) to produce the symmetrical +/-10% case. This would permit asymmetrical bands and support more complex calcs as well….
2 -
@Avinash Krishnaram-Oracle Very good idea!
1 -
@Abhinav Chaurasia-Oracle FYI - good enhancement to the CF framework.
1 -
Good enhancement request
0


