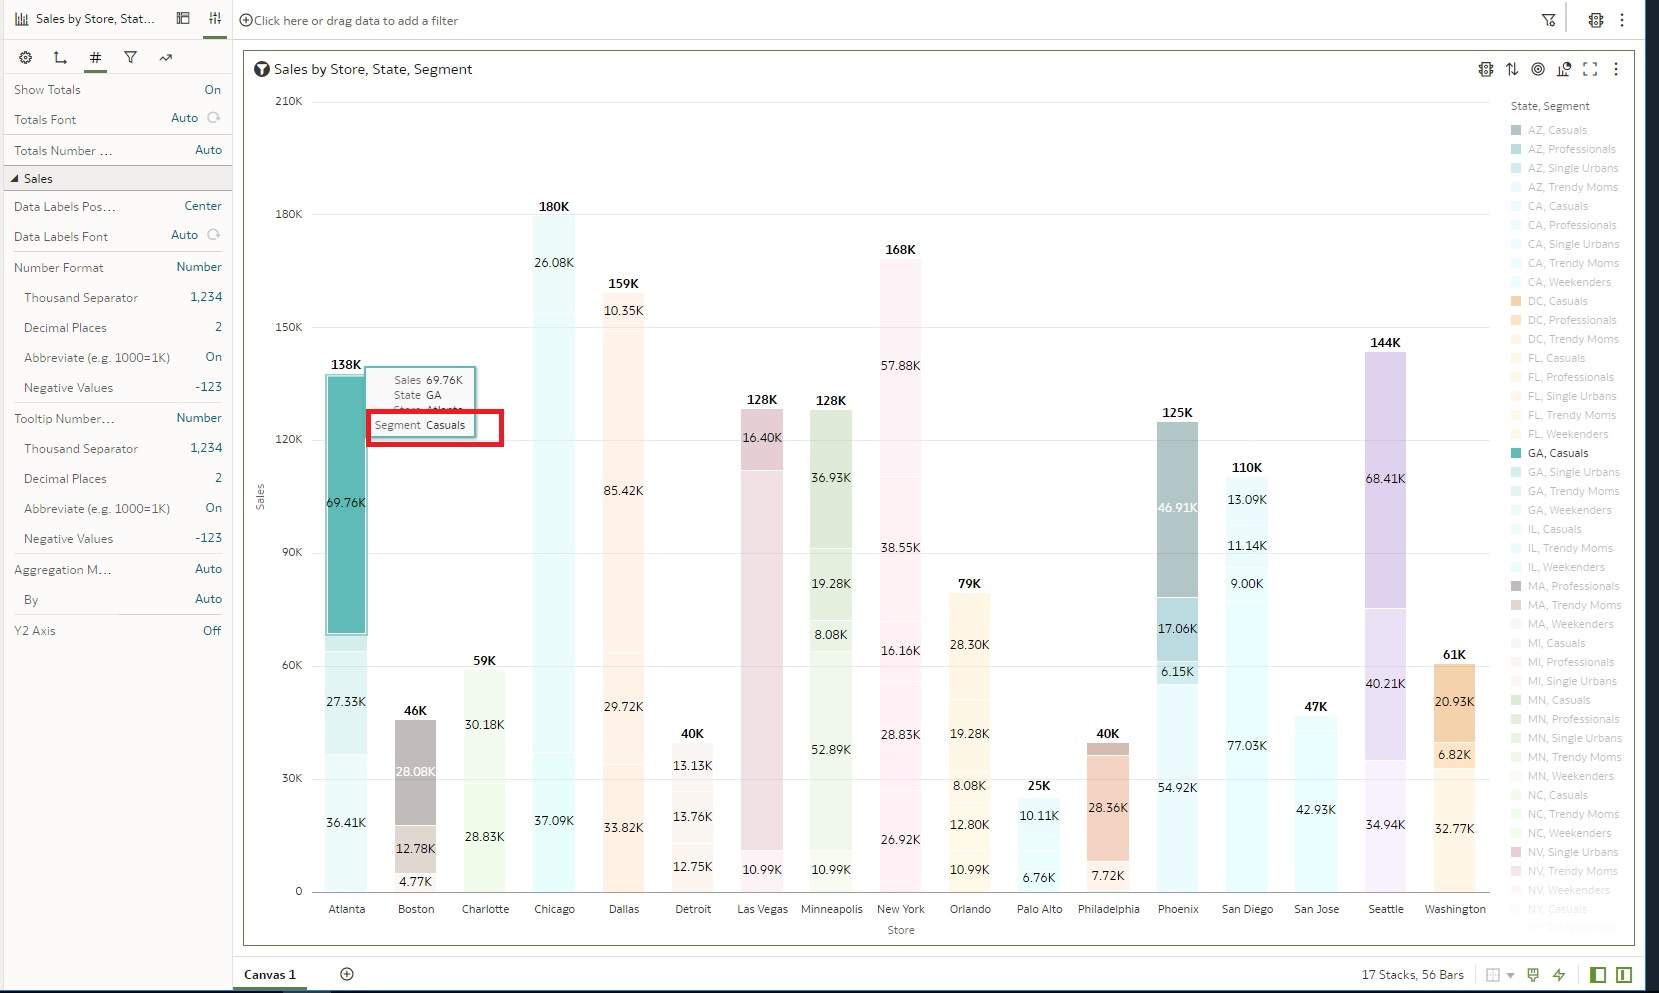
Is there any way we can make the label stays on stacked bar graph? Excel has this Add data label feature. I am wondering if that can place the label anywhere user wants to place.
@Tony_OAS_Apex_User - We have a 'Data Labels Position' option that allows you to select where you want the label to be displayed. Below is a screenshot where I selected the center position, showing how the label is displayed.
Thank you also I just found Add Notes feature that accomplishes what i wanted. .
is there anyway We can put other attribute to show? It's driven by the Values.. but wish i can control what to show in there.
Hi,
Isn't that what the "Tooltip" part of the visualization is for?
You can drag other columns (or also the same you already have in Values, Categories etc.) in there and they will show in the tooltip on mouse-over.
Thanks Gianni, I just posted to forum oracle :) . I guess there's no way to do it. i just wanted category to show on the bar all the time. instead of the number. i can make it with Tree map .. but Stacked bar graph. since it uses Value to make that Label available.
Ah, sorry, I misunderstood your request: you don't want to display something else as a tooltip, you want to replace the value of the bars, which is a measure, by something else.
As you said, no, not supported for now.
You can submit an idea to add this feature in the future: https://community.oracle.com/products/oracleanalytics/categories/idealab-oracle-analytics-cloud-server
Explore how to build agents using code in AI Data Platform. We'll create an agent that examines and analyzes the contents of a Github repository and reports its findings. The session demonstrates how to use different developer tools to create agents including the AIDP extension for VS Code and Codex. Using these tools we…
What is wrong with this code
Am I missing something or is there no way to search through previous posts to make sure I don't duplicate a question? All I see on the filter options are tags or status… a general search for a word or phrase would be helpful.
We were under the impression that when exporting a visualization in DV to CSV format hidden columns would be include from the grammar panel. This is not happening. See below for a screenshot showing 3 hidden columns that do not appear when exporting the pivot table to CSV. This seems to have worked a month or so back but…
Migrated RPD from obiee12c to OAS 2024. post migration when we try to access dashboards on OAS we are getting below error: State: HY000. Code: 10058. [NQODBC] [SQL_STATE: HY000] [nQSError: 10058] A general error has occurred. (HY000) State: HY000. Code: 43275. [nQSError: 43275] Message returned from OBIS…
There is no option for legend title in many visualization types.